Office Space
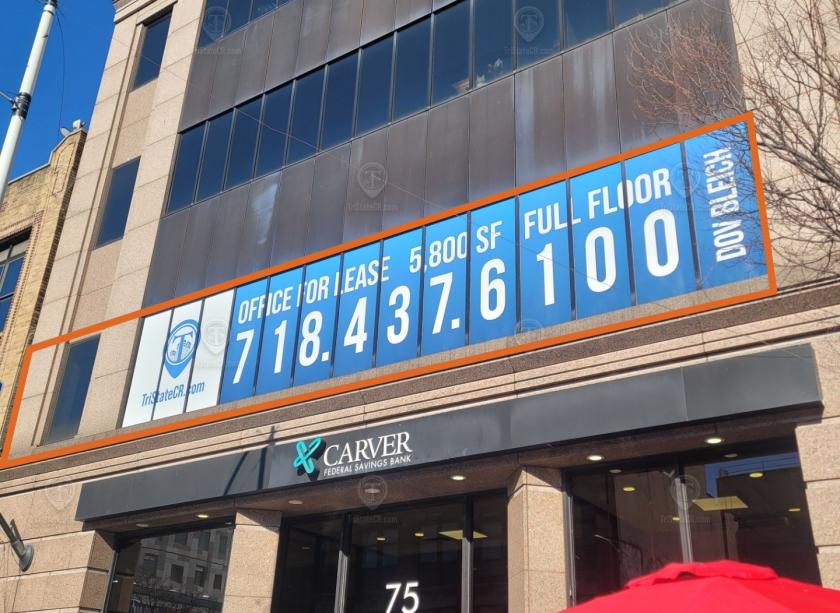
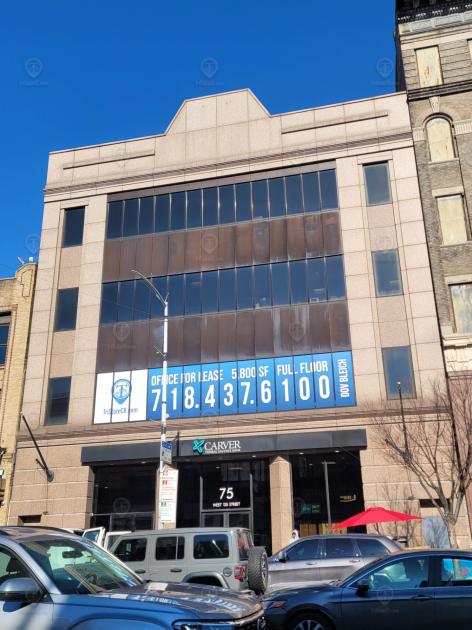
75 West 125th Street New York, NY 10027
75 West 125th Street New York, NY 10027
Details & Description
Property Highlights
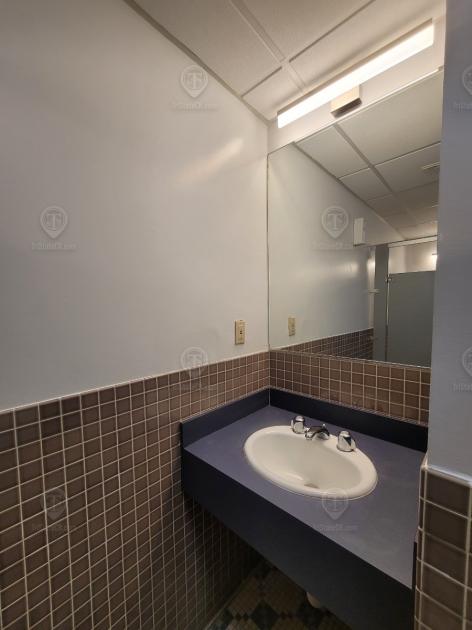
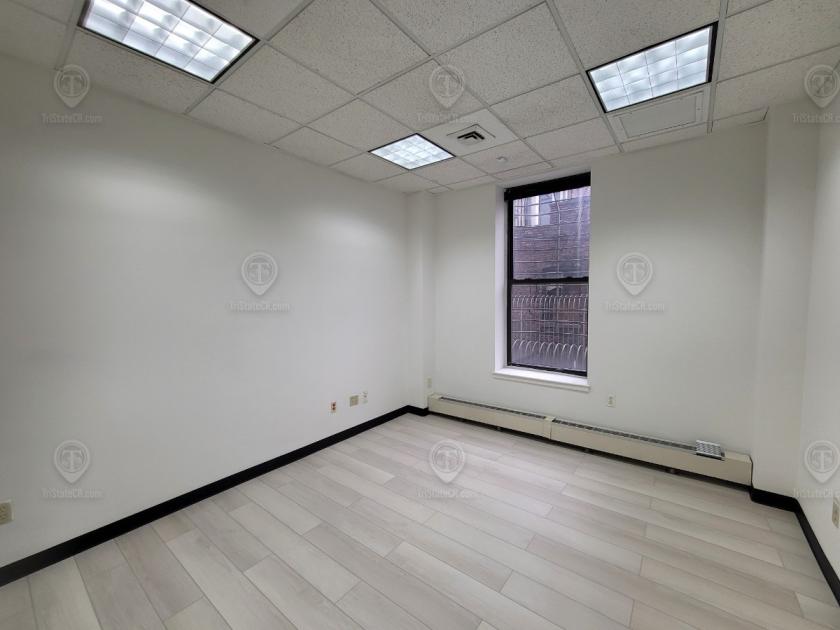
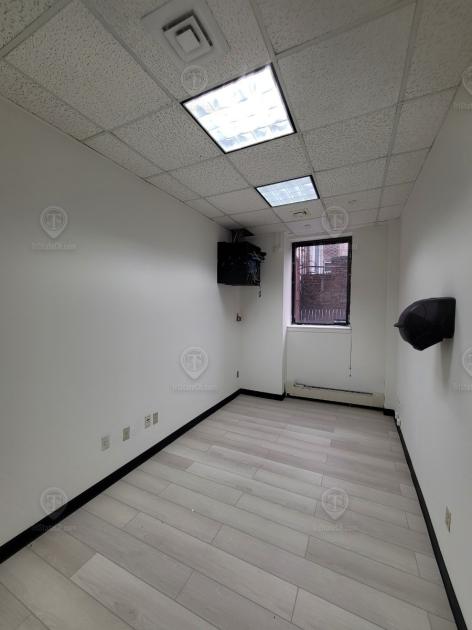
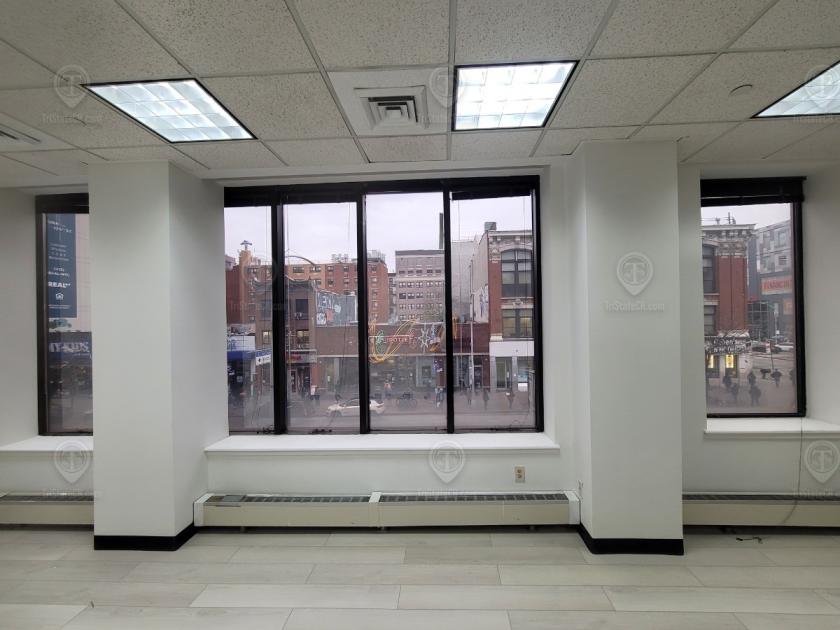
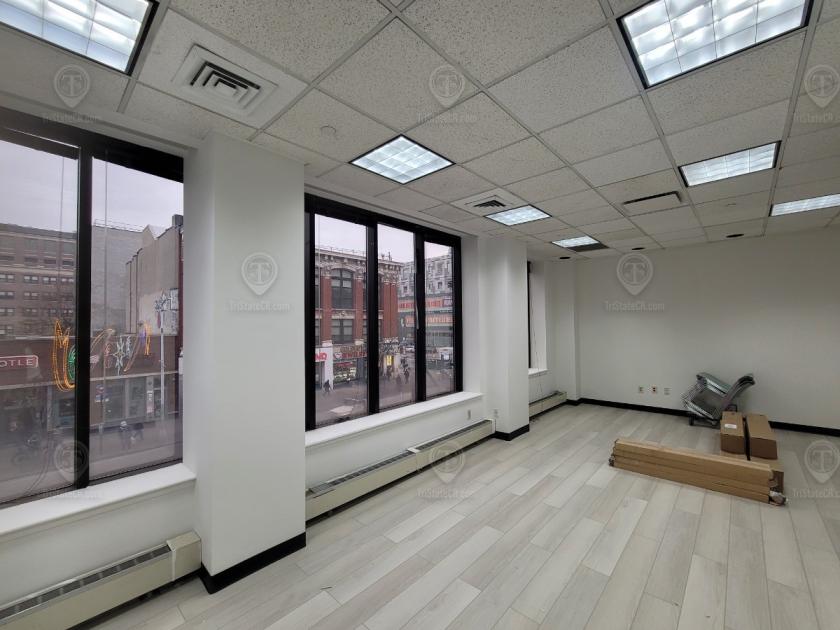
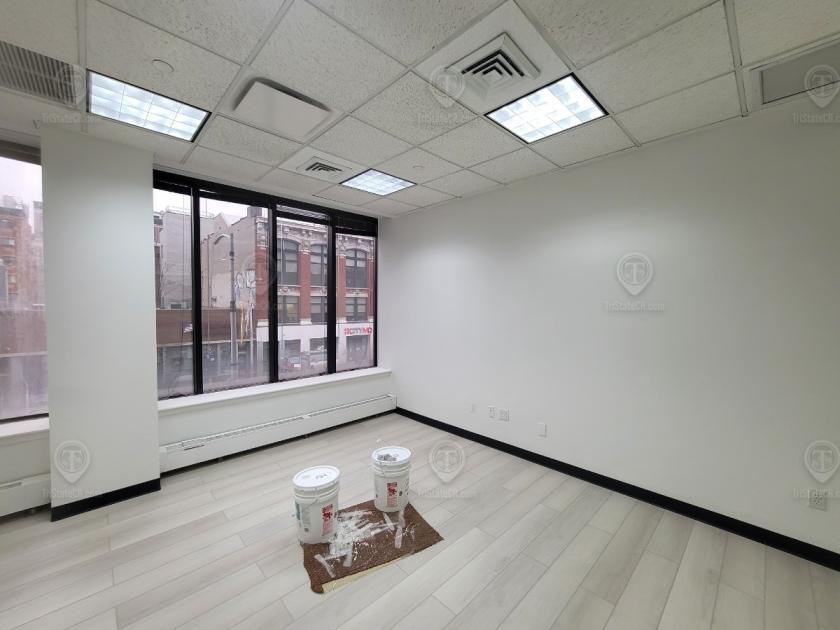
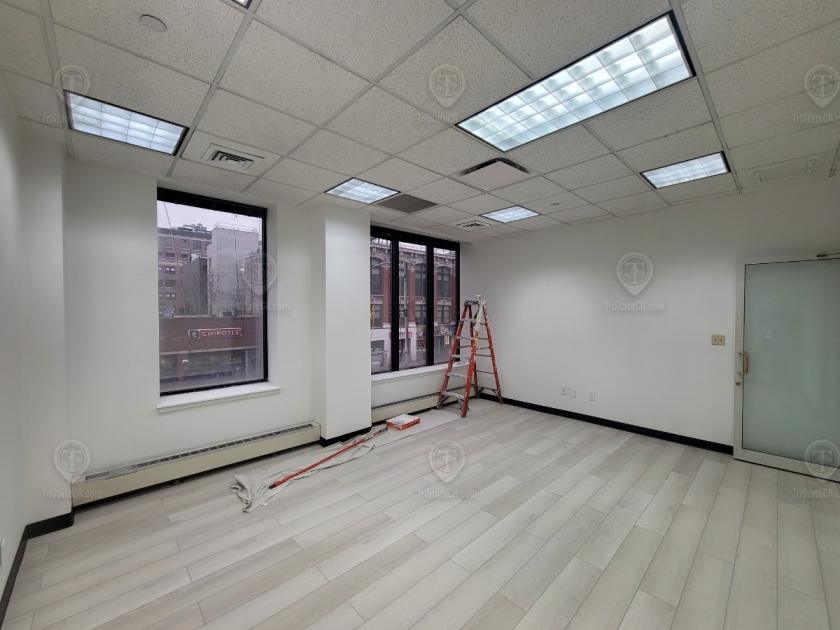
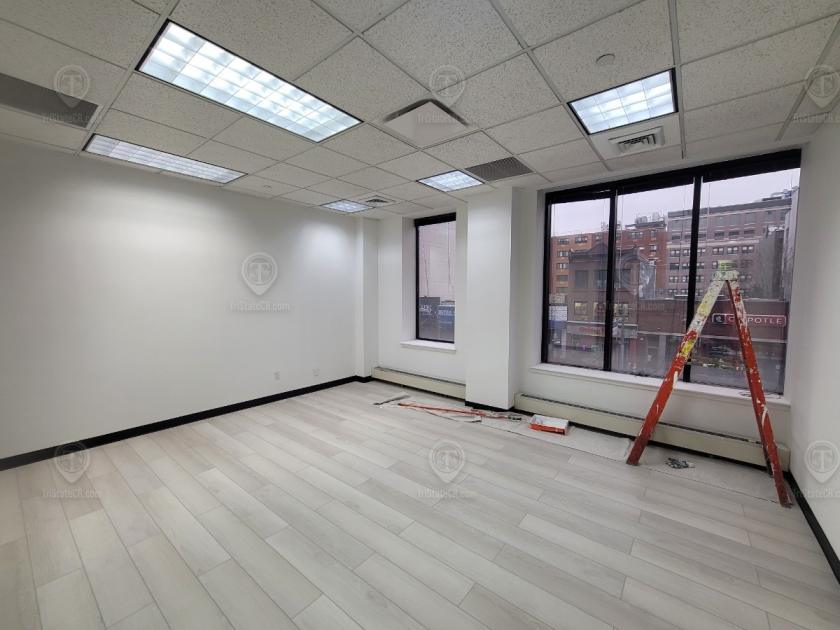
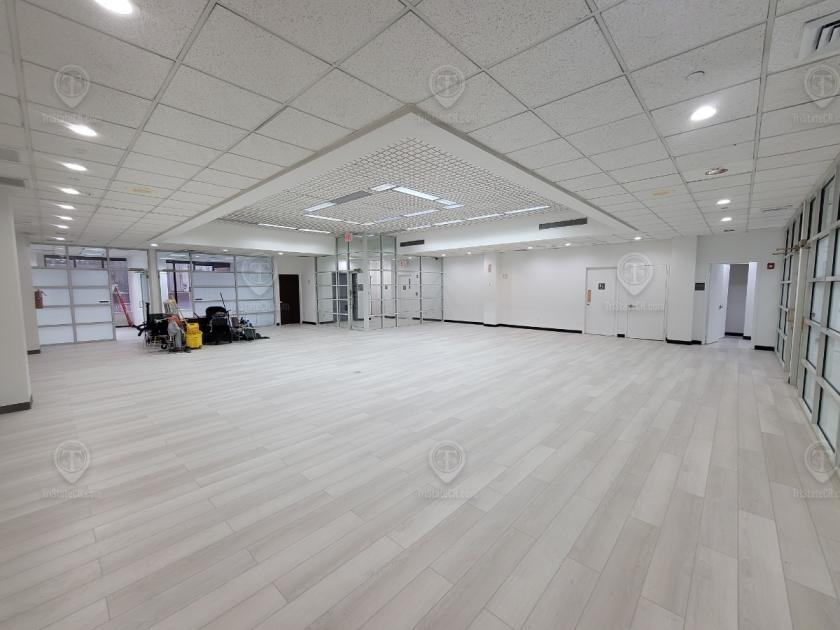
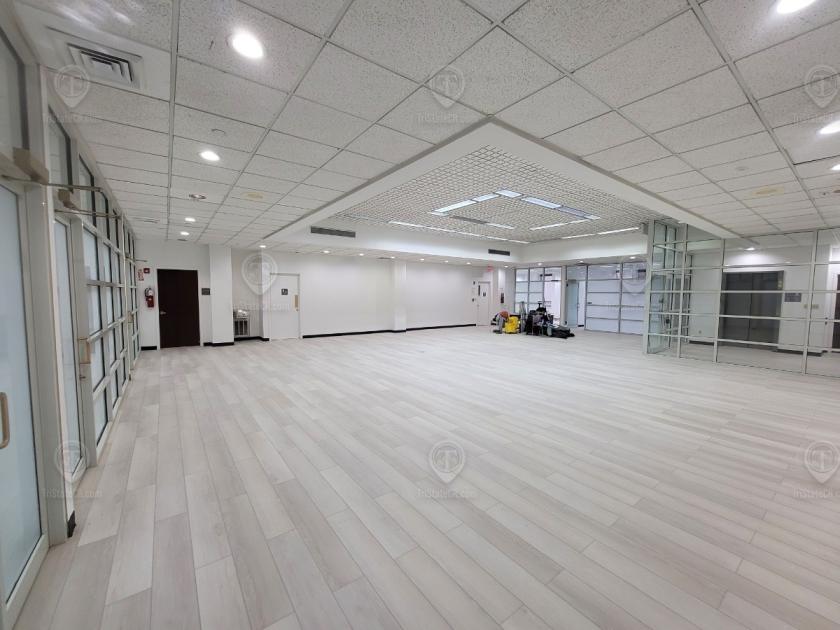
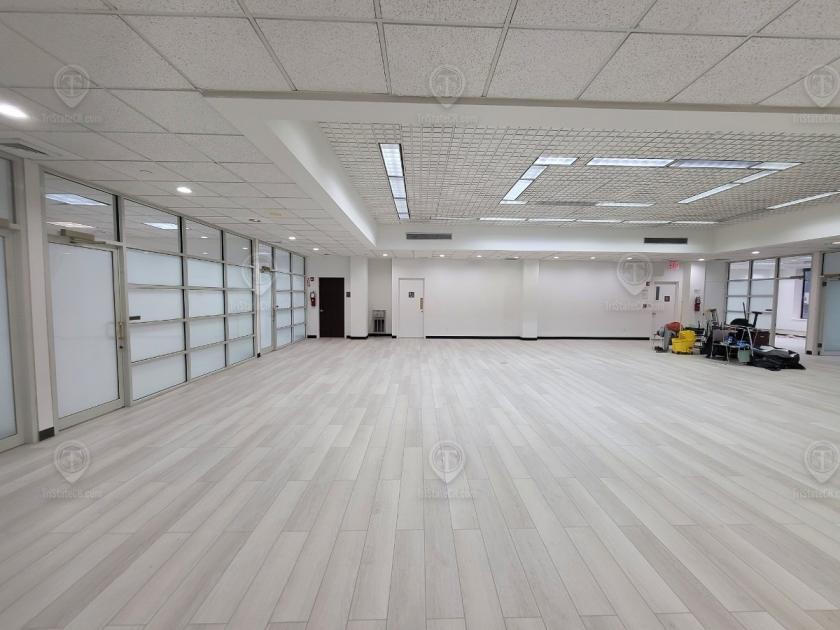
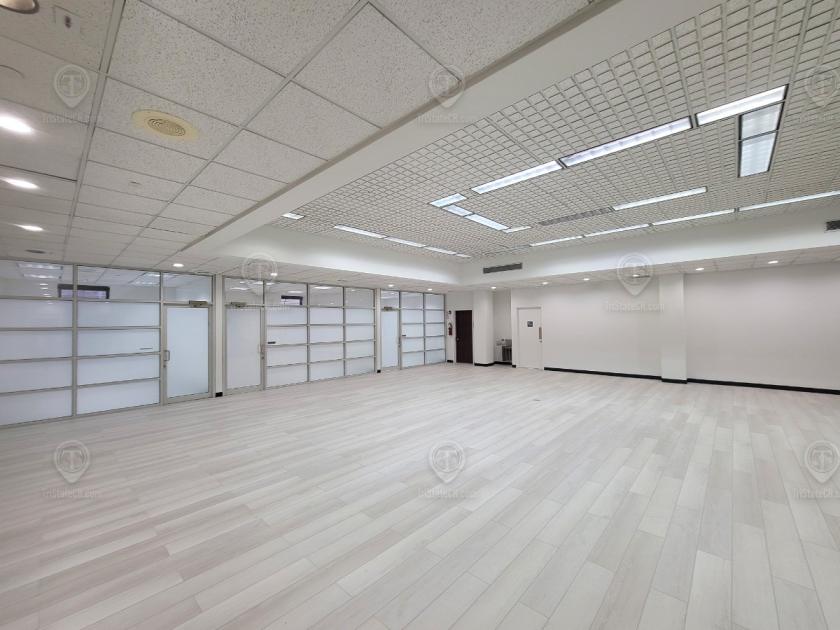
- • Beautifully finished office, Turn key ready
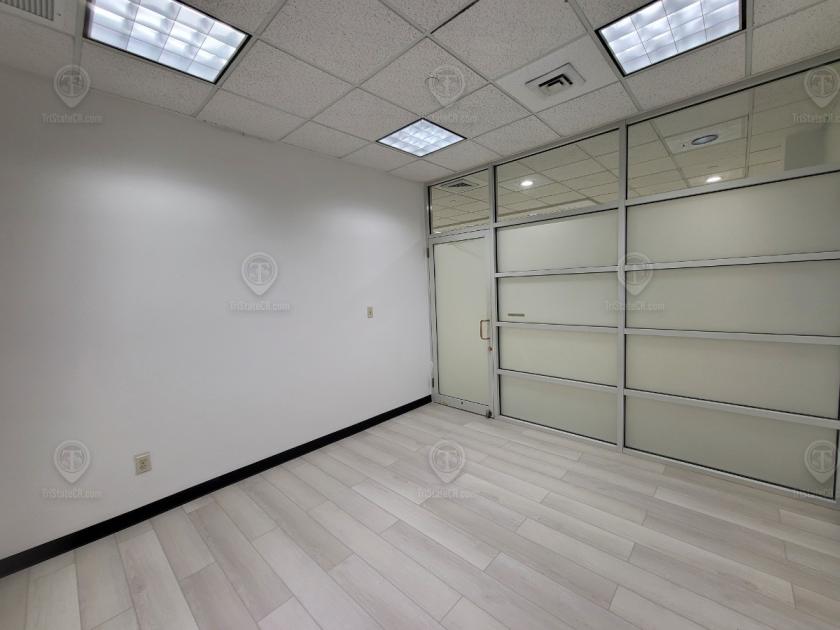
- • Tremendous sunlight
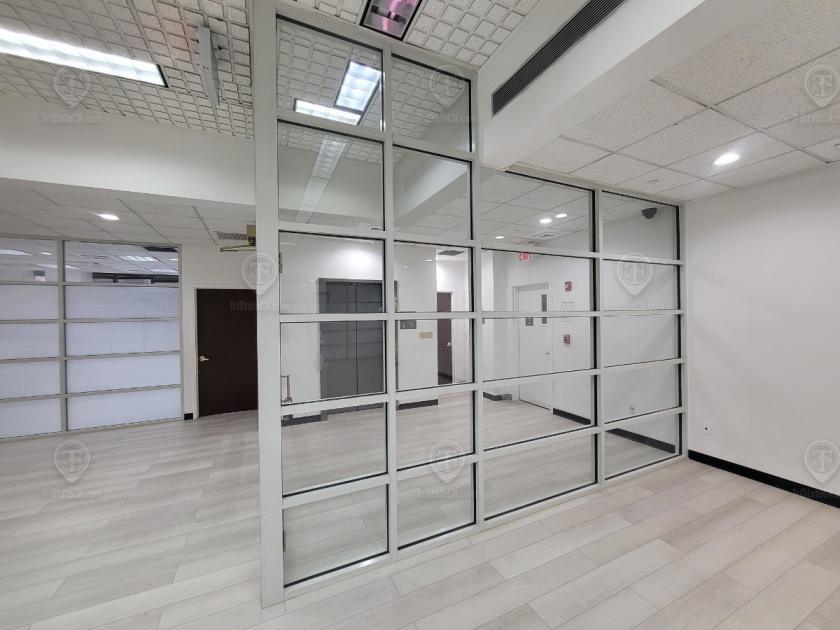
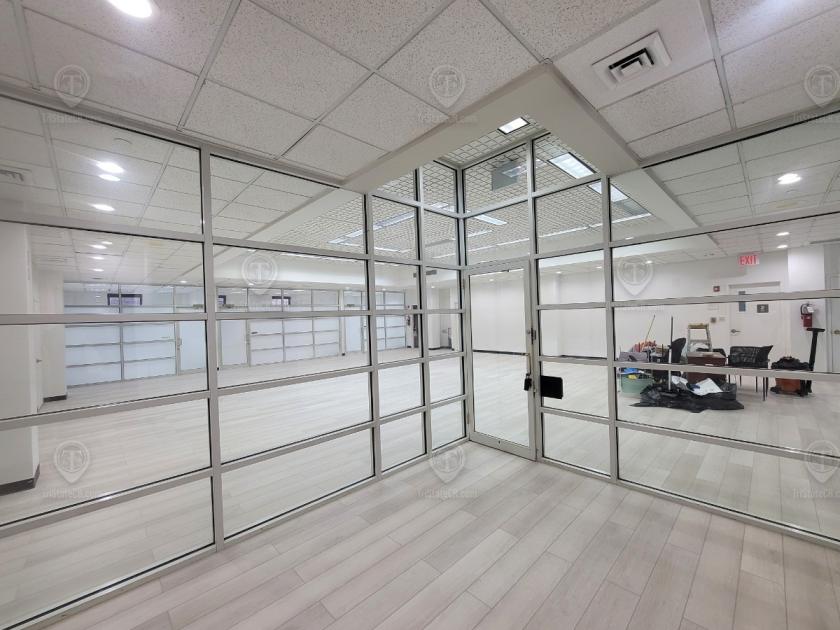
- • Private offices and large open areas
- • Private floor with elevator access
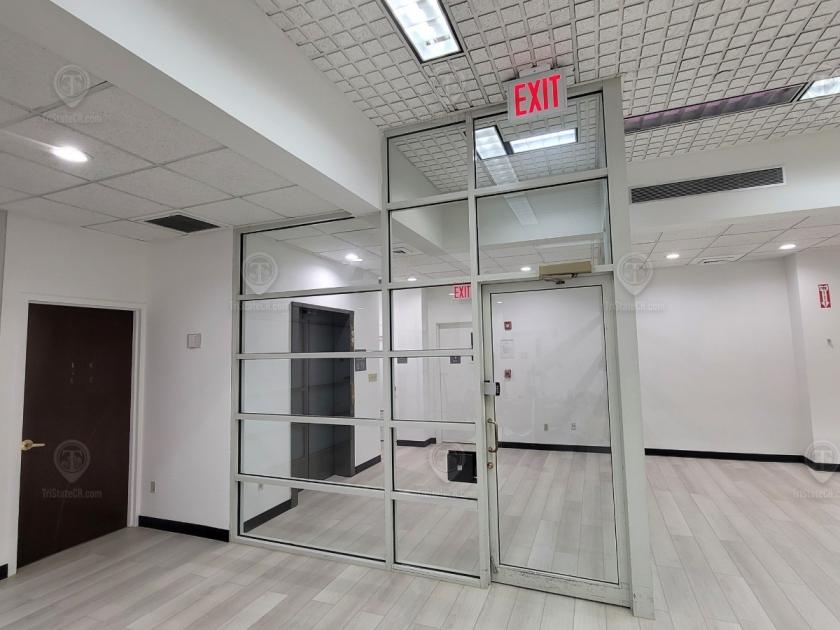
- • Front desk grand entrance
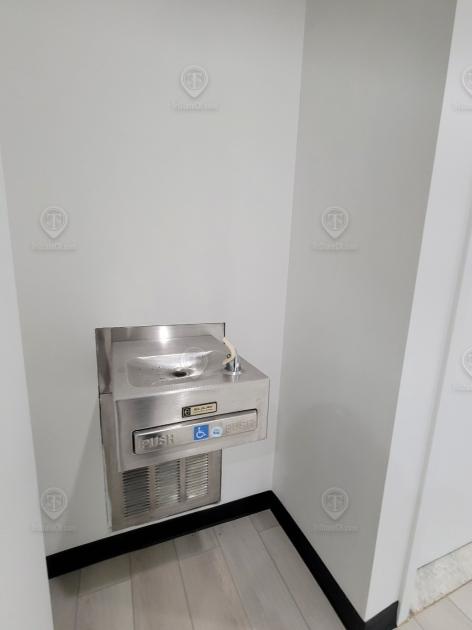
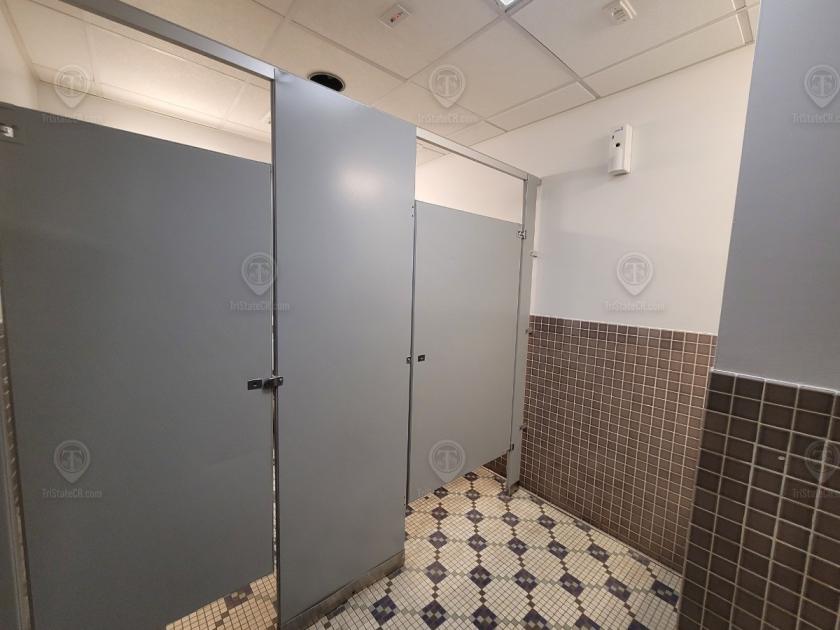
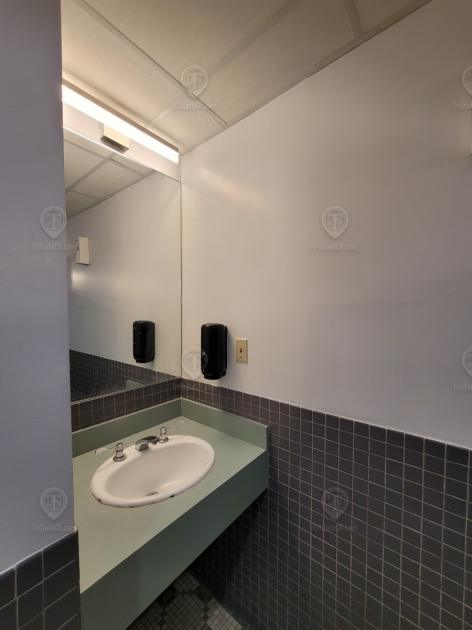
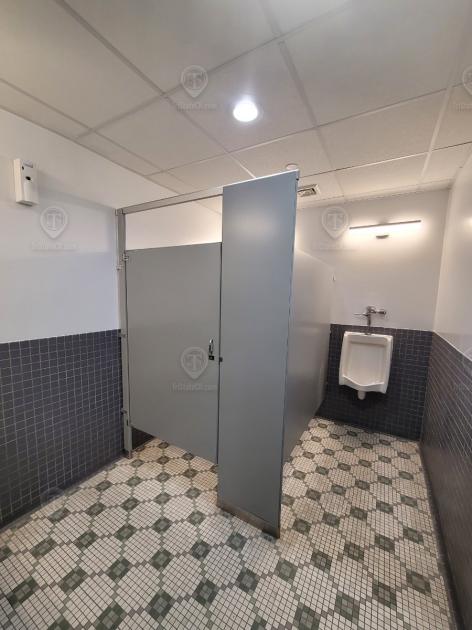
- • Fully ADA compliant
Additional Photos
Listing Agents

Shlomi Bagdadi
O: 718-437-6100
info@tristatecr.com
O: 718-437-6100
info@tristatecr.com
While we strive to provide the most accurate information, all listing information, and demographic data, is provided by third-parties. As such, MyEListing will not be responsible for the accuracy of the information. It is strongly recommended that you verify all information with the listing agent, and any relevant agencies, prior to making any decisions.