Industrial Properties
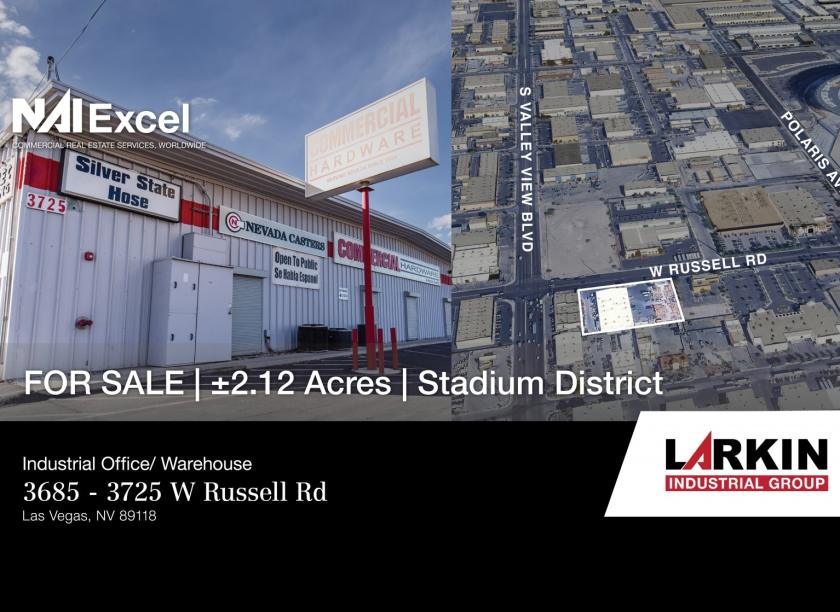
3685-3725 West Russell Road Las Vegas, NV 89118
3685-3725 West Russell Road Las Vegas, NV 89118
Details & Description
Property Highlights
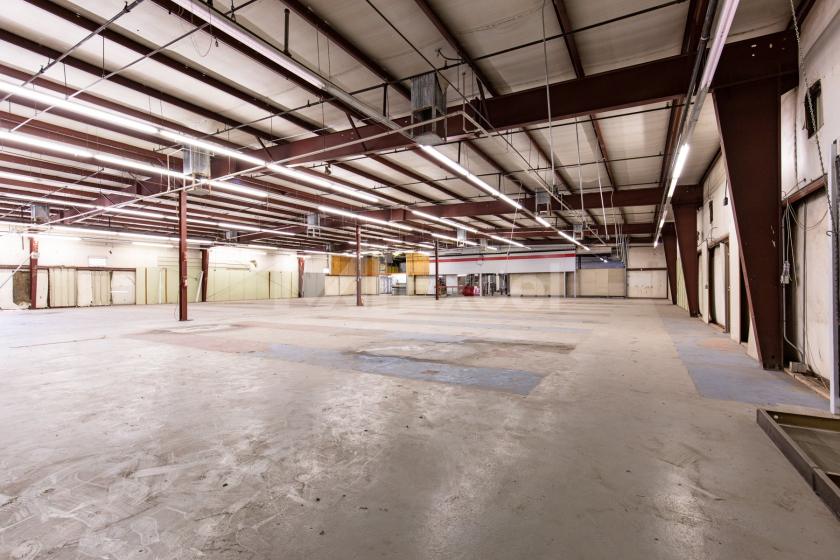
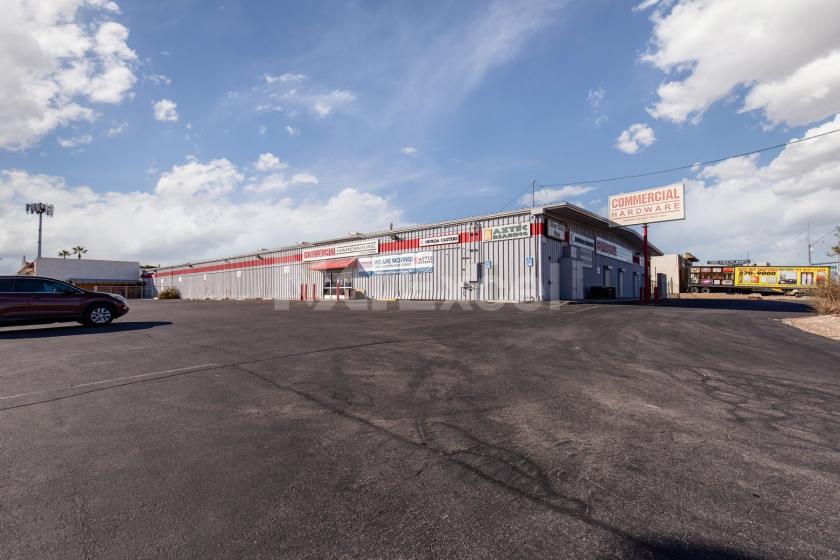
- • ±23,000 SF Total SF
- • ±3,909 SF HVAC Office
- • 1997 Metal Construction
- • 3 Phase, 600 Amps
- • 13’ – 15’ Clear Height
- • Three (3) Grade Level Doors
Additional Photos

Listing Agents

Leslie Houston
O: 702-383-3383
M: 702-534-1705
lhouston@naiexcel.com
O: 702-383-3383
M: 702-534-1705
lhouston@naiexcel.com
While we strive to provide the most accurate information, all listing information, and demographic data, is provided by third-parties. As such, MyEListing will not be responsible for the accuracy of the information. It is strongly recommended that you verify all information with the listing agent, and any relevant agencies, prior to making any decisions.


