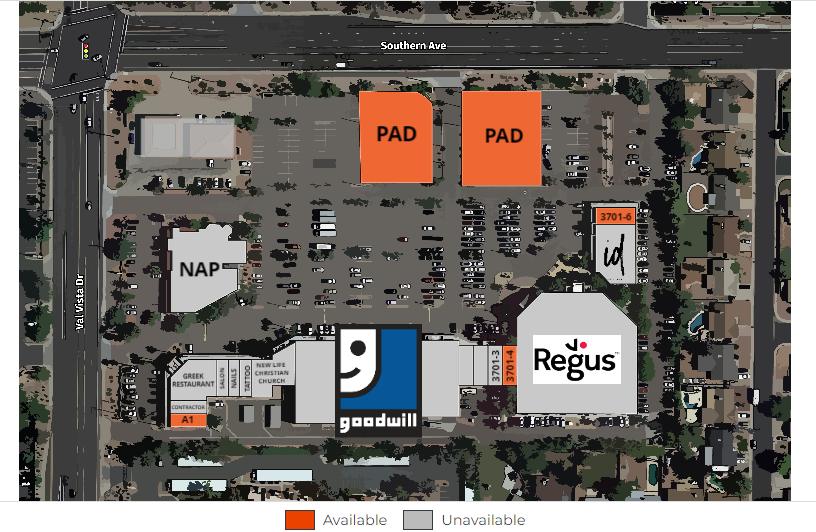
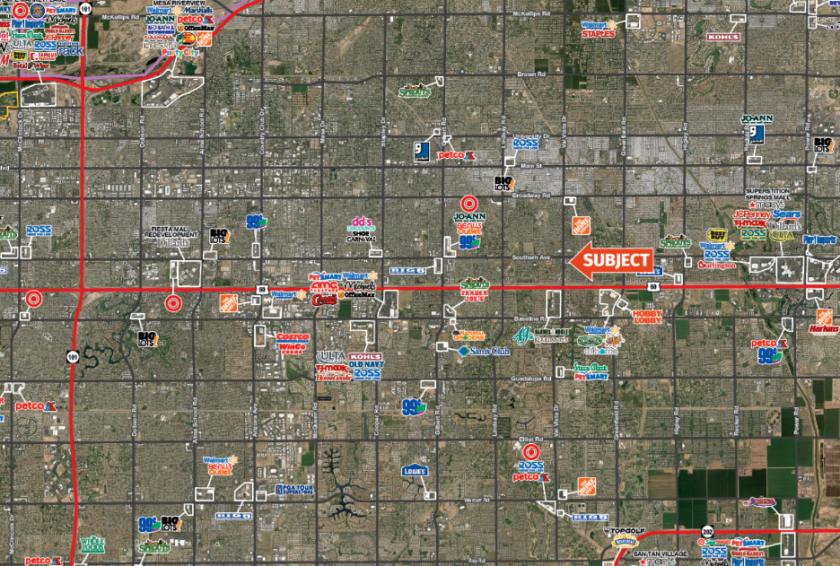
1-Mile | 3-Miles | 5-Miles | ||
---|---|---|---|---|
Total Population | 17,685 | 148,283 | 359,965 | |
Population Median Age | 36 | 39 | 38 | |
Population by Age | 0-9 Yrs | 2682 (15%) | 20387 (13%) | 49318 (13%) |
10-19 Yrs | 2218 (12%) | 17760 (11%) | 49244 (13%) | |
20-29 Yrs | 2865 (16%) | 22129 (14%) | 49728 (13%) | |
30-39 Yrs | 2546 (14%) | 18171 (12%) | 45945 (12%) | |
40-49 Yrs | 2315 (13%) | 16685 (11%) | 43341 (12%) | |
50-59 Yrs | 2295 (12%) | 17718 (11%) | 44249 (12%) | |
60-69 Yrs | 1261 (7%) | 15814 (10%) | 36379 (10%) | |
70+ Yrs | 1503 (8%) | 19619 (13%) | 41761 (11%) | |
Median HH Income | $71,361 | $60,037 | $65,037 | |
Total Household Income | < 24K | 694 (11%) | 9203 (16%) | 20002 (15%) |
25-49K | 1151 (19%) | 13377 (24%) | 29029 (22%) | |
50-74K | 1286 (21%) | 10249 (18%) | 24227 (18%) | |
75-99K | 877 (14%) | 7214 (13%) | 16469 (12%) | |
100-199K | 1663 (28%) | 11940 (21%) | 30252 (23%) | |
200K+ | 233 (3%) | 2638 (4%) | 7983 (6%) | |
Highest Education Level | No Diploma | 704 | 8905 | 21822 |
Diploma or GED | 2776 | 25678 | 56889 | |
Some College | 3575 | 27738 | 64928 | |
Assoc. Degree | 1376 | 9996 | 22532 | |
Bachelors Degree | 2079 | 18688 | 47333 | |
Higher Degree | 981 | 9256 | 23993 | |
Total Housing Units | 6,186 | 64,390 | 144,785 | |
--Owner-Occupied | 3,943 | 35,424 | 82,895 | |
--Renter-Occupied | 1,961 | 19,197 | 45,069 | |
Owner-Occupied Values | < 100K | 131 | 7207 | 10264 |
100-199K | 934 | 6557 | 14406 | |
200-299K | 1890 | 12109 | 29516 | |
300-399K | 584 | 5056 | 15820 | |
400-499K | 229 | 2156 | 6823 | |
500K+ | 175 | 2339 | 6065 | |
Total Working Age Population | 13,708 | 116,908 | 279,853 | |
In Work Force | 9,499 | 73,613 | 181,011 | |
Not In Work Force | 4,209 | 43,294 | 98,841 | |
Workforce Employed | 9,074 | 70,306 | 171,811 | |
Workforce Unemployed | 425 | 3,280 | 9,104 | |
Civlian Workforce | 9,499 | 73,586 | 180,915 | |
Military Workforce | 0 | 28 | 96 | |
Total Households | 5,905 | 54,620 | 127,963 | |
Family Households | 4,078 | 35,589 | 86,934 | |
Non-Family Households | 1,826 | 19,031 | 41,029 | |
Married Couple | 2,984 | 26,119 | 64,227 | |
Other Family | 1,094 | 9,470 | 22,707 | |
Married w/Child | 1,405 | 9,629 | 25,532 | |
Single Male w/Child | 123 | 1,203 | 3,187 | |
Single Female w/Child | 490 | 3,612 | 8,440 |
Population Change Last Two Decades - Plus Projection
2000 | % | 2010 | % | 2020 | % | 2030 | |
---|---|---|---|---|---|---|---|
Arizona | 5,130,632 | +25 | 6,392,017 | +14 | 7,286,100 | +14 | 8,284,900 |
Maricopa County | 3,072,149 | +24 | 3,817,117 | +16 | 4,436,900 | +15 | 5,107,700 |
Total Working Age Population:
Total Households:
Total Working Age Population:
Total Households:
Total Working Age Population:
Total Households: