Retail Space
124-06 Metropolitan Avenue Queens, NY 11415
124-06 Metropolitan Avenue Queens, NY 11415

Details & Description
Property Highlights
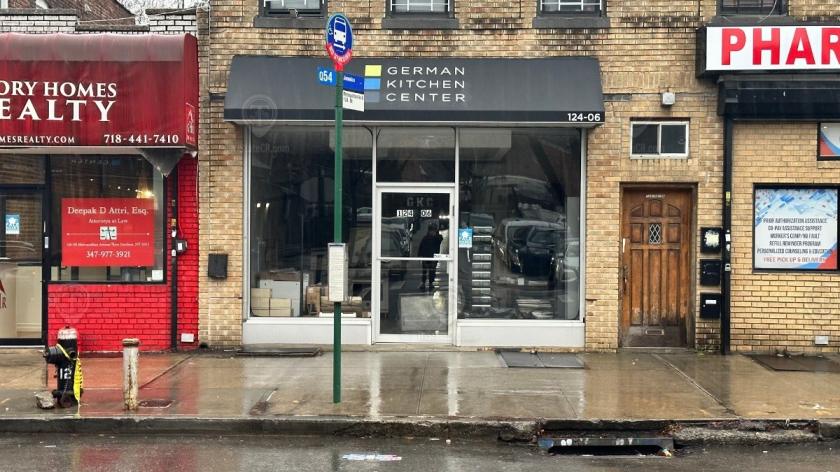
- • Open-glass retail storefront
- • Bus stops right in front of the store
- • Currently used as a showroom for home fixtures
- • All uses would be considered
- • Large office complex directly across the street
- • 600 SF basement
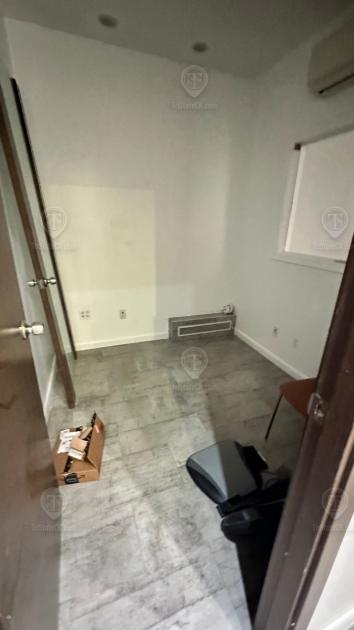
Additional Photos


Listing Agents

Shlomi Bagdadi
O: 718-437-6100
info@tristatecr.com
O: 718-437-6100
info@tristatecr.com
While we strive to provide the most accurate information, all listing information, and demographic data, is provided by third-parties. As such, MyEListing will not be responsible for the accuracy of the information. It is strongly recommended that you verify all information with the listing agent, and any relevant agencies, prior to making any decisions.