Office Space
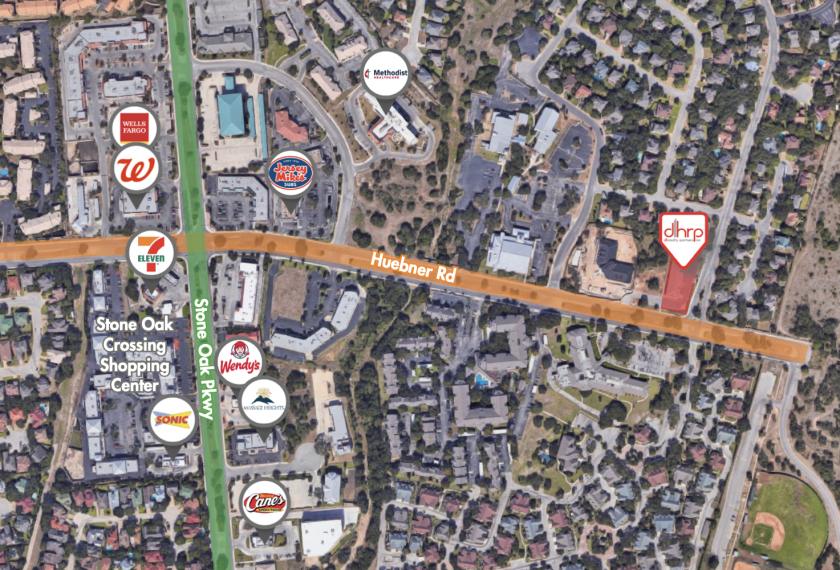
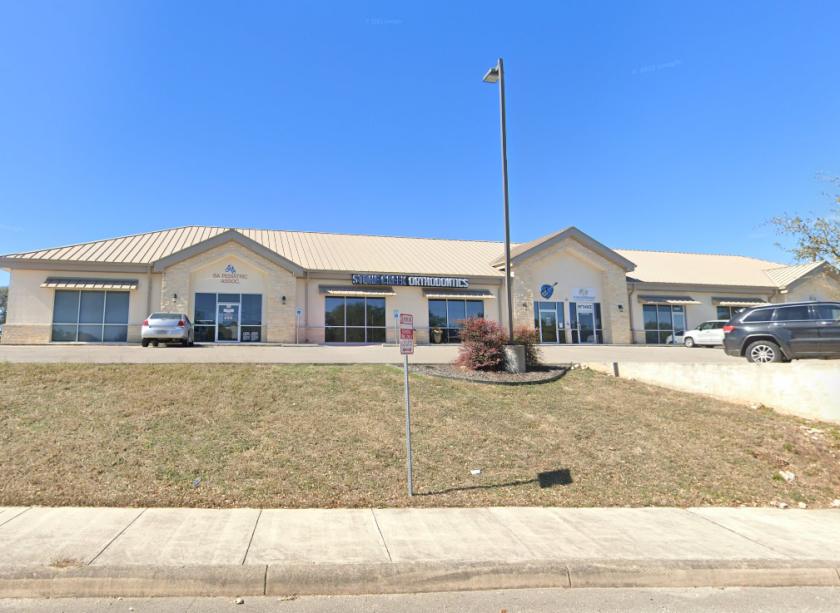
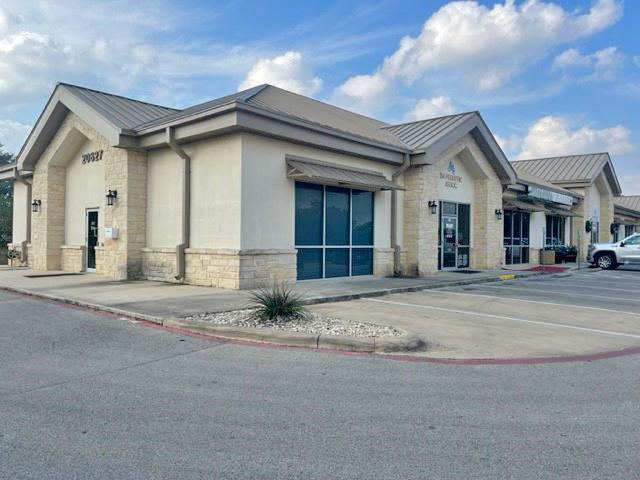
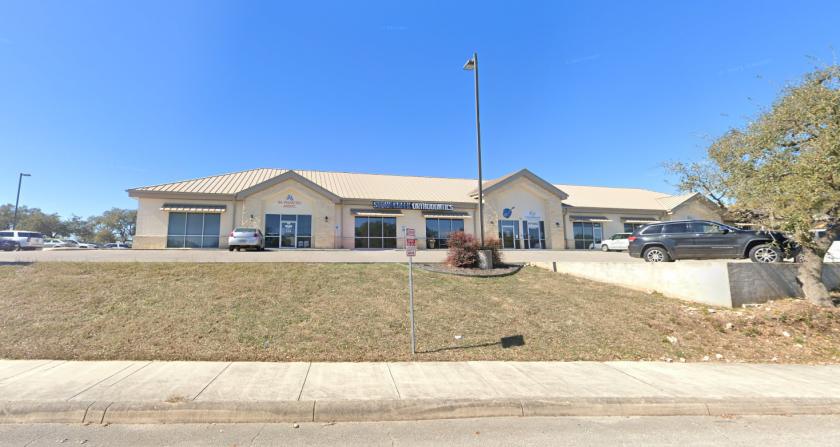
20627 Huebner Road San Antonio, TX 78258
20627 Huebner Road San Antonio, TX 78258
Details & Description
Property Highlights
• Close proximity to Methodist Stone Oak Hospital and North Central Baptist
• Situated in Stone Oak, one of the highest income and growth trade areas
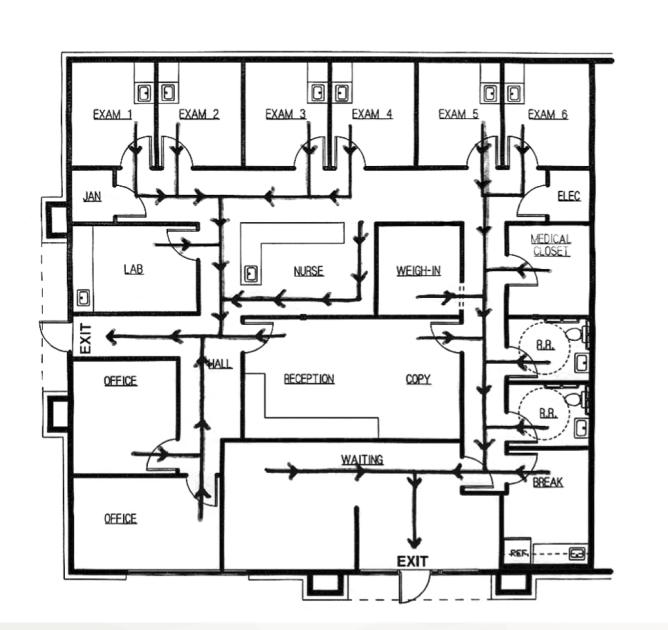
Additional Photos

Listing Agents

Matthew Baylor
O: 210-222-2424
M: 210-381-3398
mbaylor@dhrp.us
O: 210-222-2424
M: 210-381-3398
mbaylor@dhrp.us

Logan Baylor
DH Realty Partners
O: 210-222-2424
M: 210-326-1095
lbaylor@dhrp.us
DH Realty Partners
O: 210-222-2424
M: 210-326-1095
lbaylor@dhrp.us
While we strive to provide the most accurate information, all listing information, and demographic data, is provided by third-parties. As such, MyEListing will not be responsible for the accuracy of the information. It is strongly recommended that you verify all information with the listing agent, and any relevant agencies, prior to making any decisions.