Office Space
1212 East Main Street Alhambra, CA 91801
1212 East Main Street Alhambra, CA 91801

Details & Description
Property Highlights
- • Located on south side of Main Street in Alhambra
- • Large parking area behind the building
- • Tenant pays for monthly rent and utilities
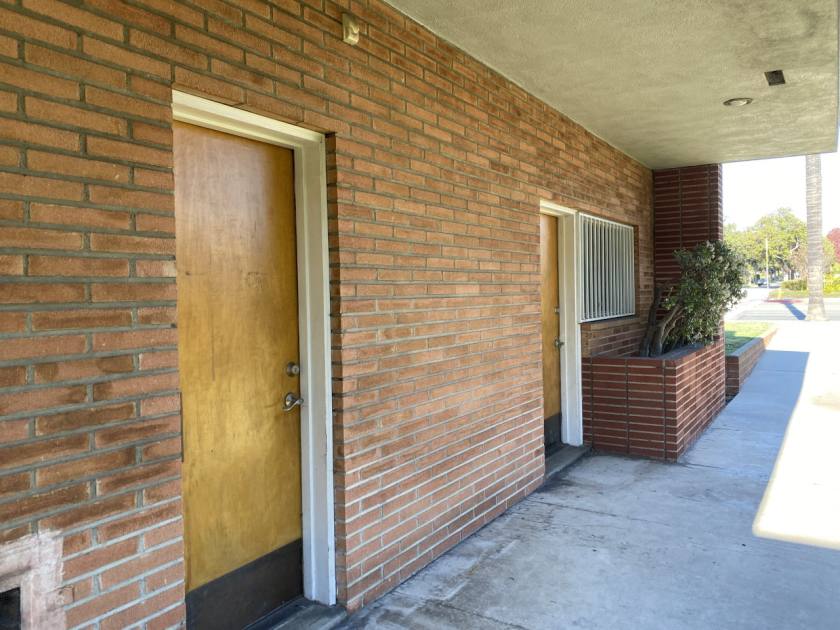
Additional Photos


Listing Agents

Camelia Vera
M: 626-484-4500
camelia.vera@coldwellbanker.com
M: 626-484-4500
camelia.vera@coldwellbanker.com
While we strive to provide the most accurate information, all listing information, and demographic data, is provided by third-parties. As such, MyEListing will not be responsible for the accuracy of the information. It is strongly recommended that you verify all information with the listing agent, and any relevant agencies, prior to making any decisions.


