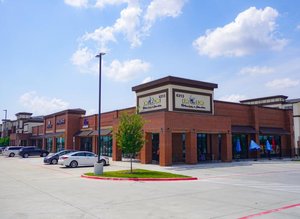
1-Mile | 3-Miles | 5-Miles | ||
---|---|---|---|---|
Total Population | 7,321 | 66,539 | 152,220 | |
Population Median Age | 35 | 36 | 36 | |
Population by Age | 0-9 Yrs | 1047 (14%) | 9861 (14%) | 22350 (14%) |
10-19 Yrs | 1177 (16%) | 10621 (15%) | 24694 (16%) | |
20-29 Yrs | 991 (13%) | 6751 (10%) | 15607 (10%) | |
30-39 Yrs | 1130 (15%) | 10056 (15%) | 21054 (13%) | |
40-49 Yrs | 1024 (13%) | 10439 (15%) | 24436 (16%) | |
50-59 Yrs | 873 (11%) | 8009 (12%) | 19920 (13%) | |
60-69 Yrs | 619 (8%) | 5607 (8%) | 12032 (7%) | |
70+ Yrs | 461 (6%) | 5196 (7%) | 12127 (7%) | |
Median HH Income | $87,102 | $96,736 | $100,752 | |
Total Household Income | < 24K | 300 (12%) | 2246 (10%) | 5061 (9%) |
25-49K | 348 (14%) | 3379 (15%) | 7227 (14%) | |
50-74K | 303 (12%) | 2415 (10%) | 6413 (12%) | |
75-99K | 512 (21%) | 3454 (15%) | 6696 (13%) | |
100-199K | 734 (30%) | 7754 (35%) | 18122 (35%) | |
200K+ | 201 (8%) | 2838 (12%) | 7627 (14%) | |
Highest Education Level | No Diploma | 567 | 4117 | 7436 |
Diploma or GED | 953 | 8118 | 15165 | |
Some College | 1201 | 8348 | 18782 | |
Assoc. Degree | 509 | 4226 | 9138 | |
Bachelors Degree | 1044 | 12458 | 31993 | |
Higher Degree | 443 | 5591 | 14267 | |
Total Housing Units | 2,550 | 23,169 | 53,990 | |
--Owner-Occupied | 1,397 | 14,593 | 34,231 | |
--Renter-Occupied | 1,001 | 7,492 | 16,915 | |
Owner-Occupied Values | < 100K | 24 | 416 | 1236 |
100-199K | 234 | 1838 | 2866 | |
200-299K | 650 | 4533 | 10374 | |
300-399K | 395 | 4637 | 10626 | |
400-499K | 89 | 2017 | 5238 | |
500K+ | 6 | 1152 | 3890 | |
Total Working Age Population | 5,617 | 49,966 | 113,960 | |
In Work Force | 3,815 | 34,808 | 79,446 | |
Not In Work Force | 1,802 | 15,158 | 34,514 | |
Workforce Employed | 3,726 | 33,852 | 76,689 | |
Workforce Unemployed | 89 | 952 | 2,715 | |
Civlian Workforce | 3,815 | 34,803 | 79,404 | |
Military Workforce | 0 | 5 | 42 | |
Total Households | 2,398 | 22,084 | 51,146 | |
Family Households | 2,035 | 17,457 | 39,675 | |
Non-Family Households | 363 | 4,627 | 11,471 | |
Married Couple | 1,506 | 13,665 | 31,979 | |
Other Family | 529 | 3,793 | 7,695 | |
Married w/Child | 710 | 6,970 | 16,495 | |
Single Male w/Child | 78 | 629 | 1,086 | |
Single Female w/Child | 181 | 1,410 | 3,322 |
Population Change Last Two Decades - Plus Projection
2000 | % | 2010 | % | 2020 | % | 2030 | |
---|---|---|---|---|---|---|---|
Texas | 20,851,820 | +21 | 25,145,561 | +18 | 29,677,668 | +18 | 34,894,452 |
Collin County | 491,675 | +59 | 782,341 | +33 | 1,039,369 | +34 | 1,391,461 |
Total Working Age Population:
Total Households:
Total Working Age Population:
Total Households:
Total Working Age Population:
Total Households: