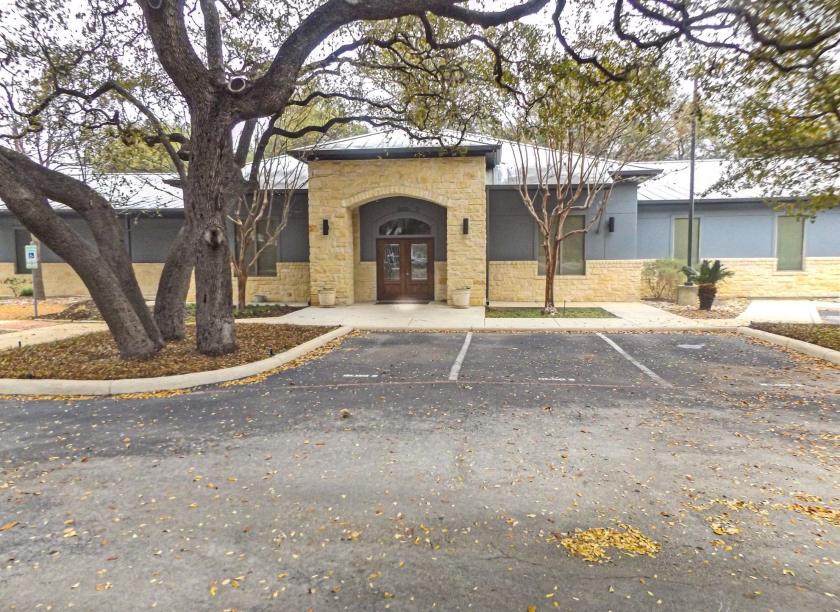
Office Space
3011 Nacogdoches Road San Antonio, TX 78217
3011 Nacogdoches Road San Antonio, TX 78217

Details & Description
Property Highlights
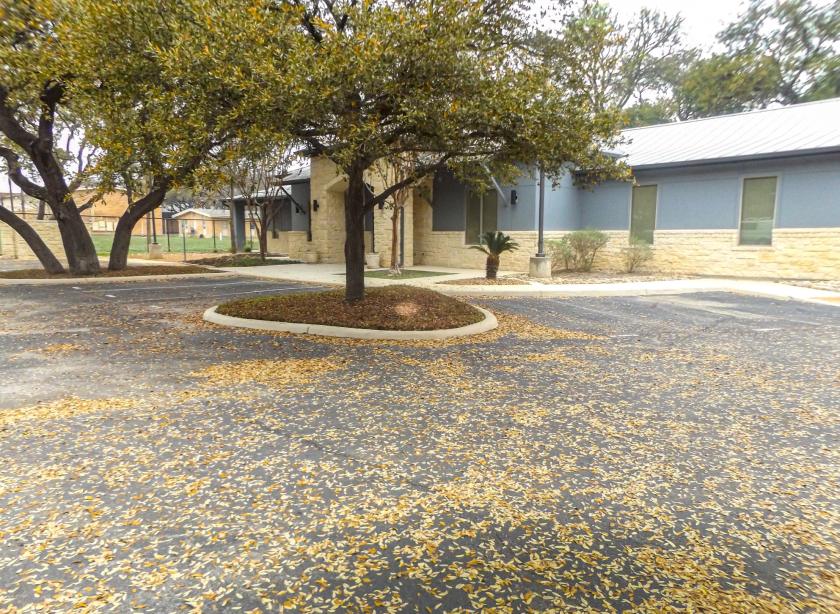
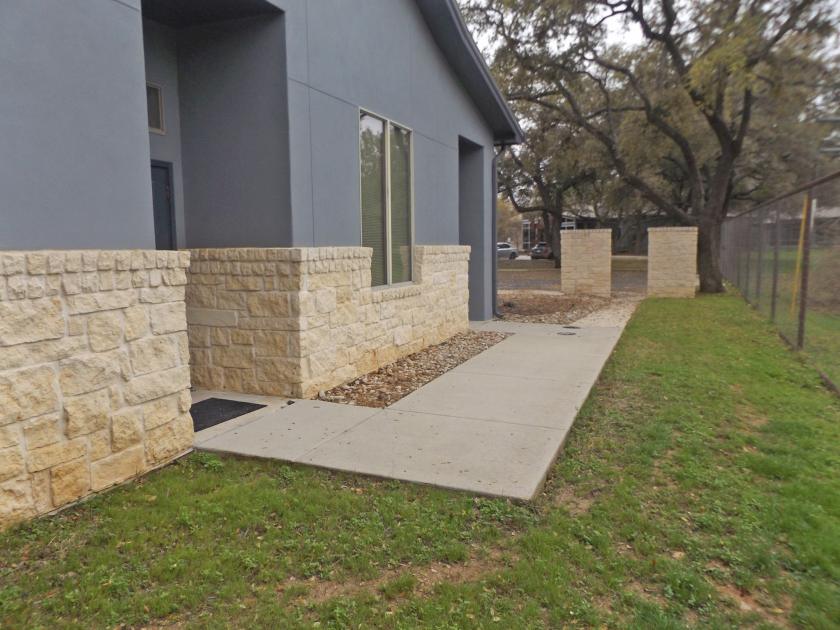
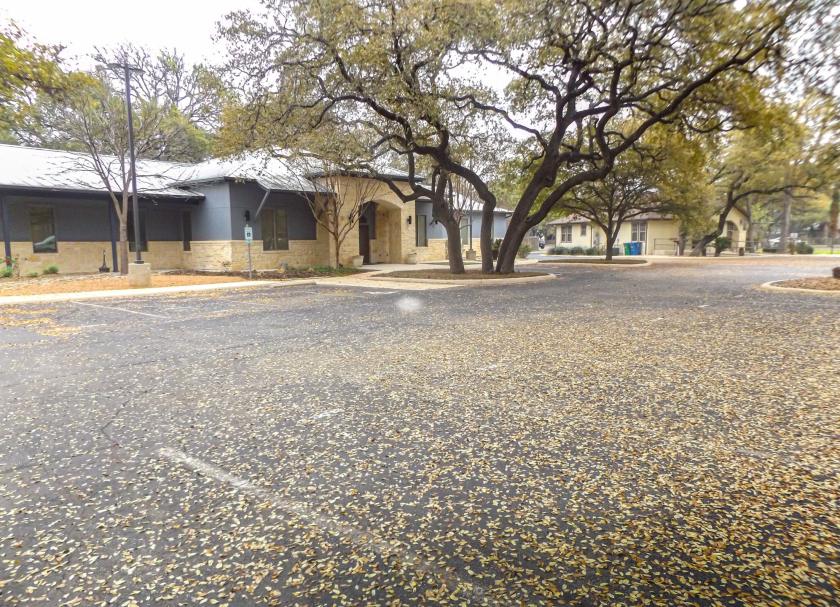
- • Standalone Office Building
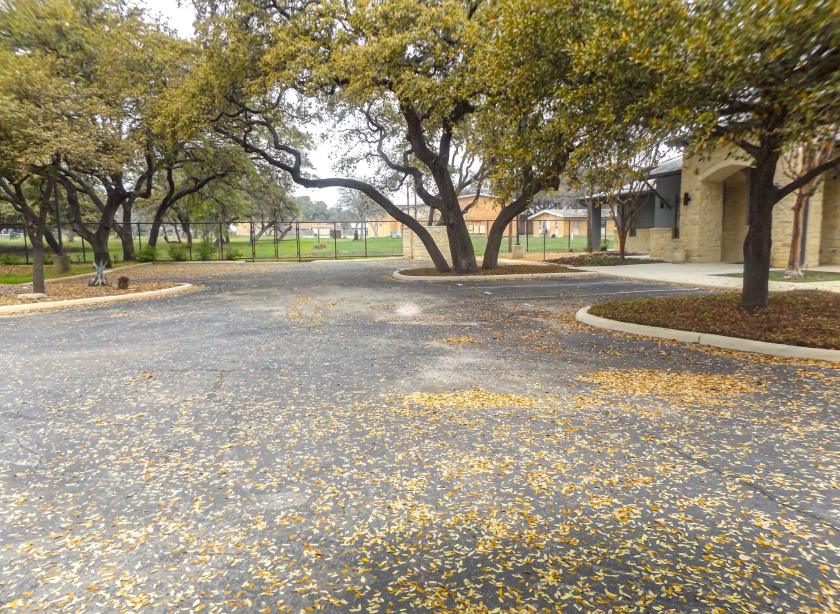
- • Quiet Setting with Large, Mature Oak Trees
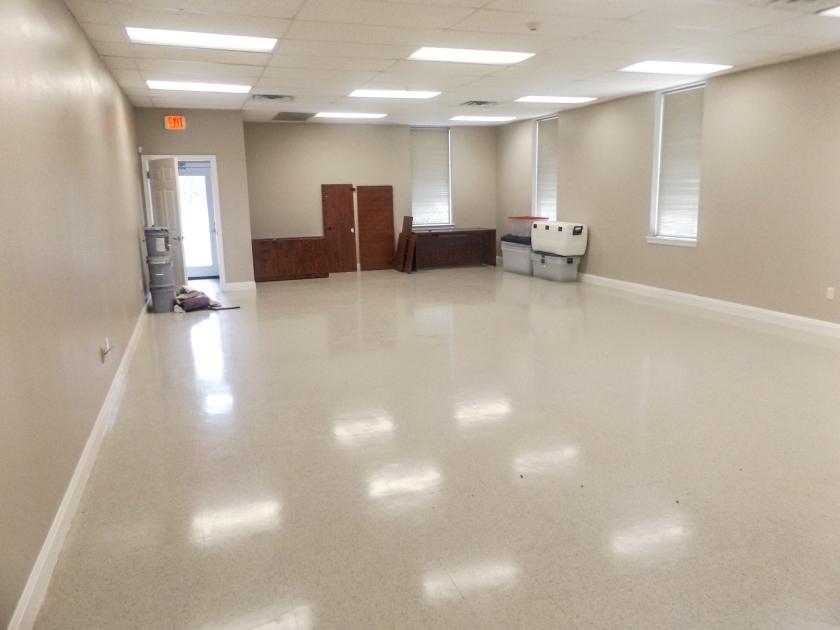
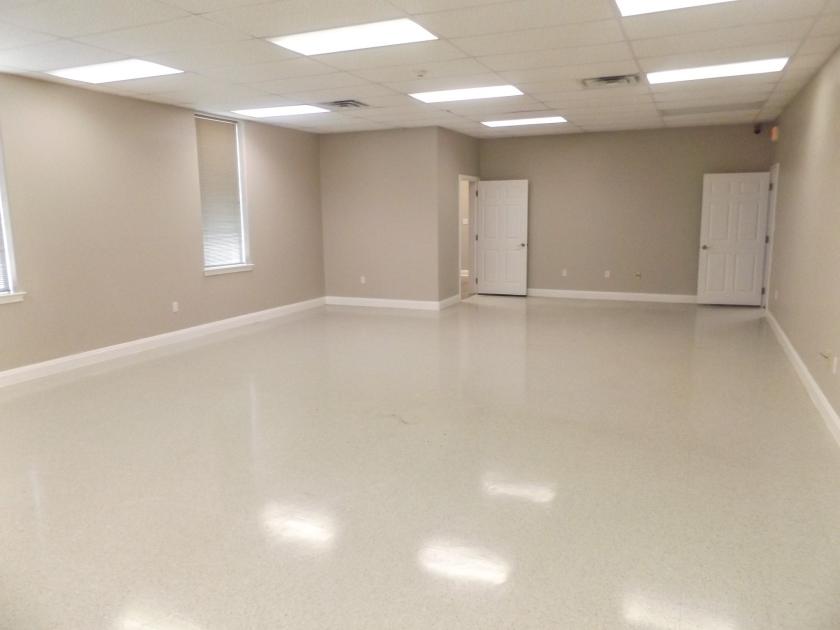
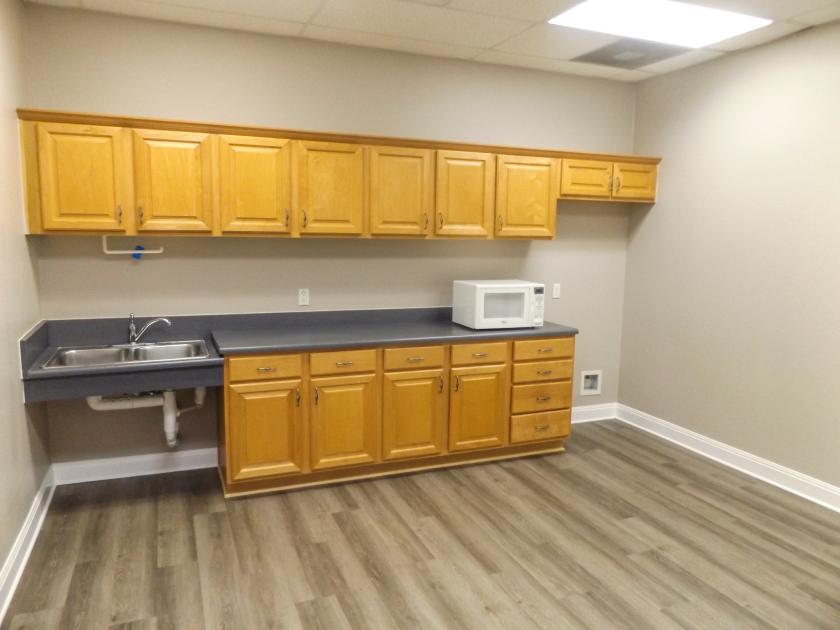
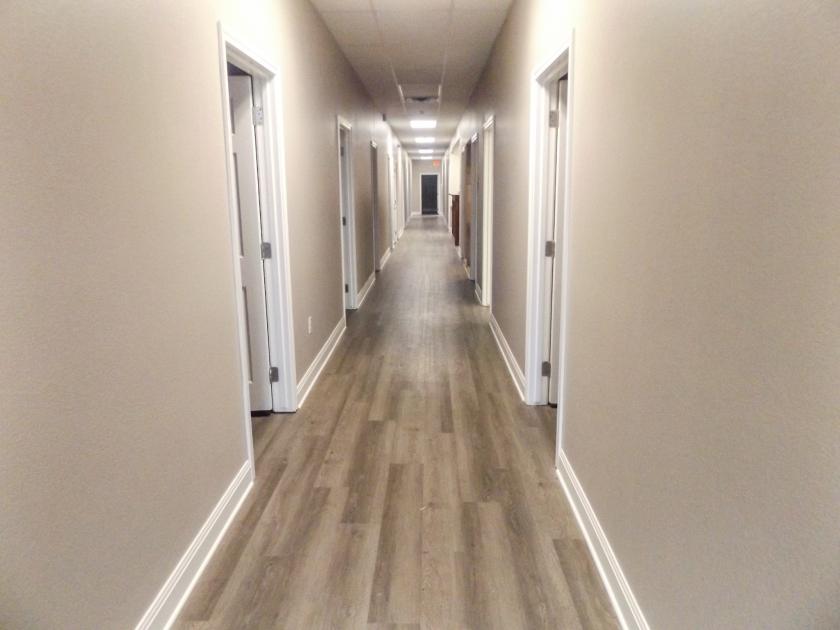
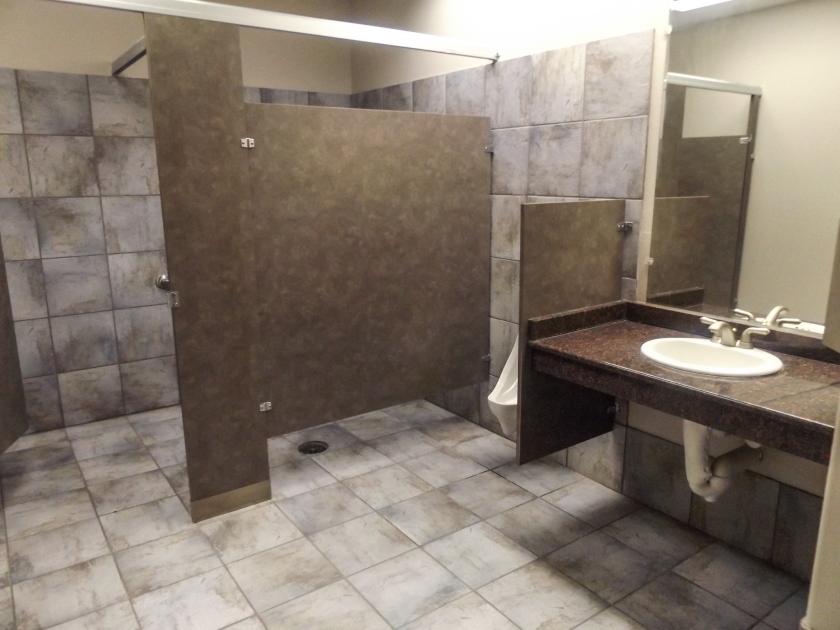
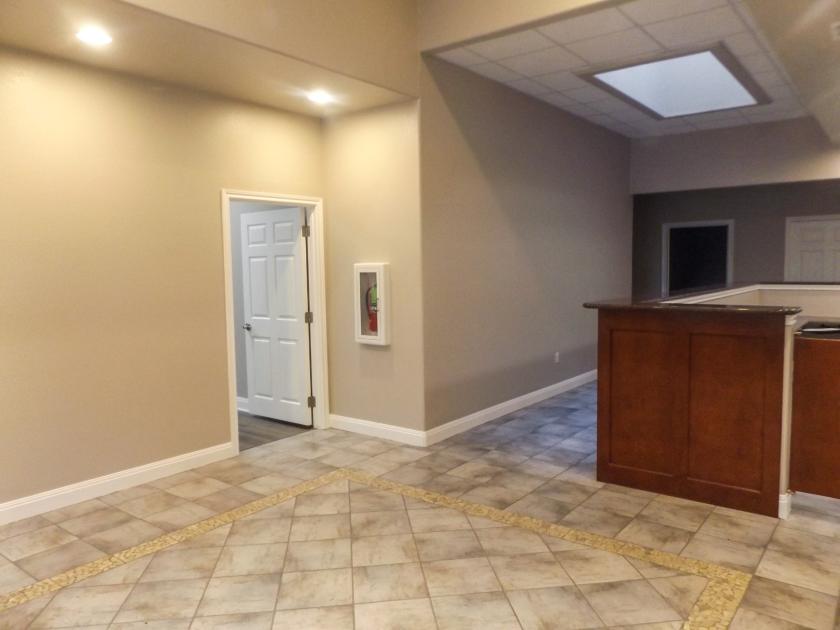
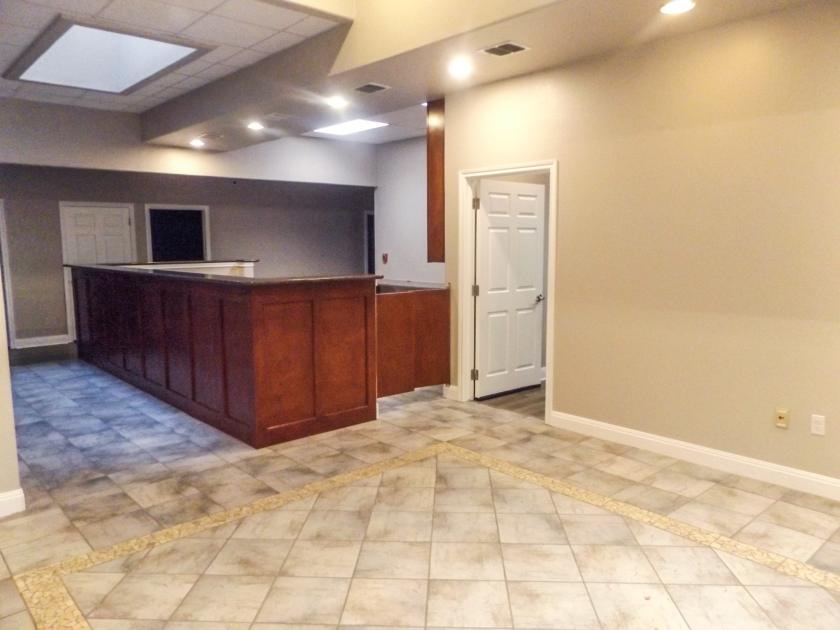
- • Move-In Ready with Recent Renovations
Additional Photos
Listing Agents

Mark Kincaid
O: 210-222-2424
M: 702-303-0338
mkincaid@dhrp.us
O: 210-222-2424
M: 702-303-0338
mkincaid@dhrp.us
While we strive to provide the most accurate information, all listing information, and demographic data, is provided by third-parties. As such, MyEListing will not be responsible for the accuracy of the information. It is strongly recommended that you verify all information with the listing agent, and any relevant agencies, prior to making any decisions.