Commercial Land
42167 Big Bear Boulevard Big Bear Lake, CA 92315
42167 Big Bear Boulevard Big Bear Lake, CA 92315

Details & Description
Property Highlights
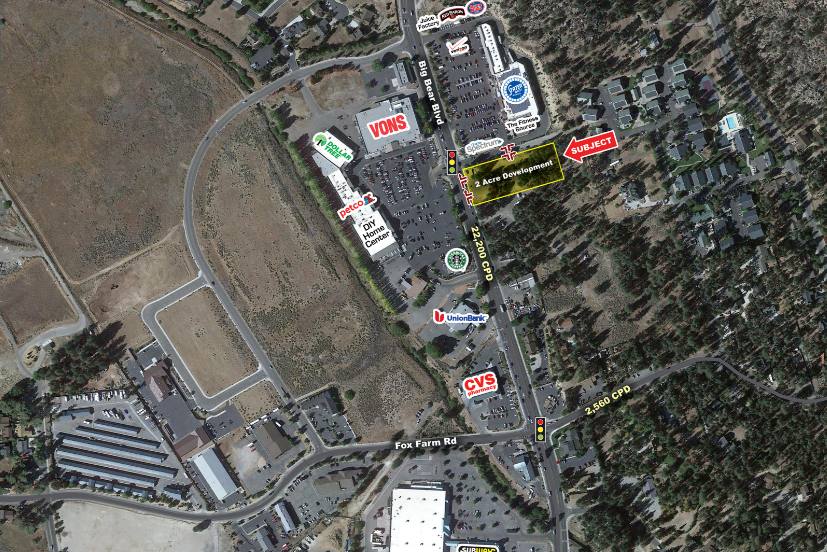
- • Great visibility off Big Bear Blvd with 22,200 CPD
- • Possibility of monument signage off Big Bear Blvd
- • Pad 1 Space Available 5,000 SF
- • Pad 2 Space Available 4,000 SF
Additional Photos


Listing Agents

Alfredo Arguello
O: 949-955-0391
M: 949-988-3205
aarguello@w-retail.com
O: 949-955-0391
M: 949-988-3205
aarguello@w-retail.com

John Romm
O: 949-955-0391
M: 949-988-3202
jromm@w-retail.com
O: 949-955-0391
M: 949-988-3202
jromm@w-retail.com
While we strive to provide the most accurate information, all listing information, and demographic data, is provided by third-parties. As such, MyEListing will not be responsible for the accuracy of the information. It is strongly recommended that you verify all information with the listing agent, and any relevant agencies, prior to making any decisions.


