Commercial Land
41st Ellis Road Sioux Falls Sioux Falls, SD 57106
41st Ellis Road Sioux Falls Sioux Falls, SD 57106
Details & Description
Property Highlights
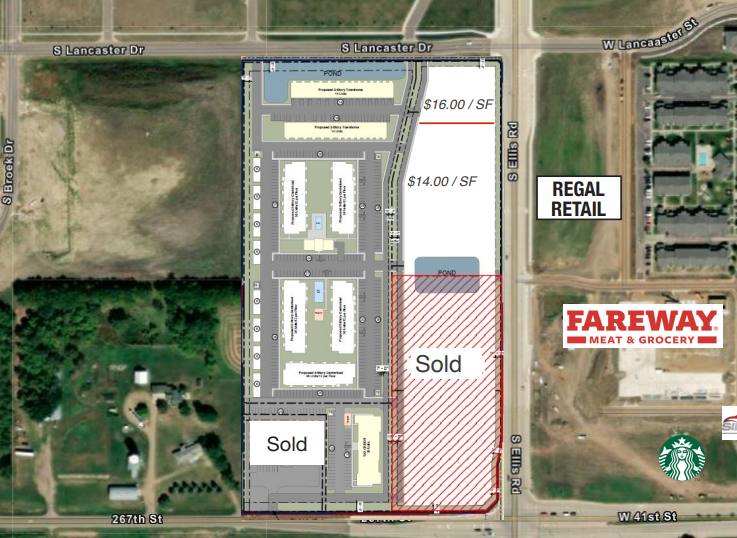
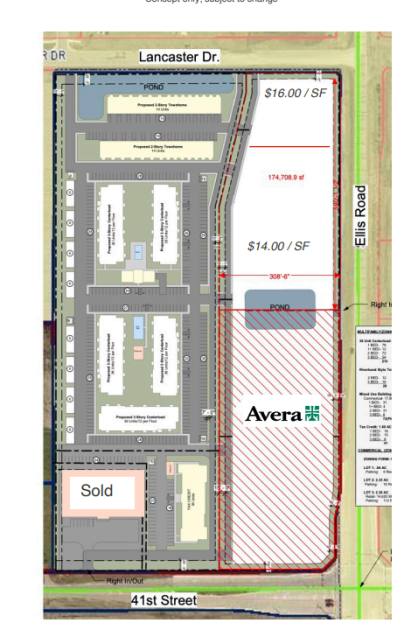
• Ellis Road frontage, the main corridor going north and south on the west side of town
• One of the fastest growing residential areas of Sioux Falls
Additional Photos


Listing Agents

Raquel Blount
O: 605-728-9092
raquel@lloydcompanies.com
O: 605-728-9092
raquel@lloydcompanies.com
While we strive to provide the most accurate information, all listing information, and demographic data, is provided by third-parties. As such, MyEListing will not be responsible for the accuracy of the information. It is strongly recommended that you verify all information with the listing agent, and any relevant agencies, prior to making any decisions.


