Industrial Properties
1952 South Buckner Boulevard Dallas, TX 75217
1952 South Buckner Boulevard Dallas, TX 75217

Details & Description
Property Highlights
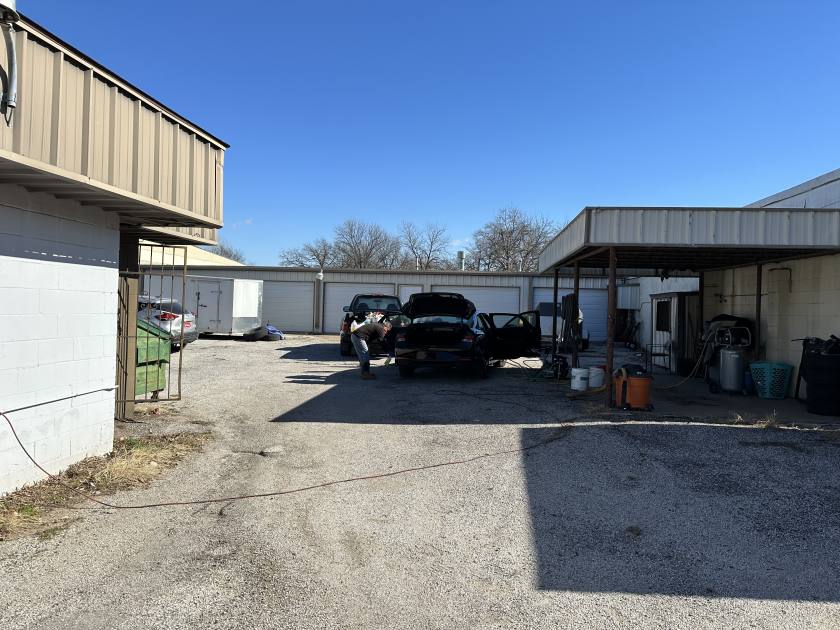
• HAVE BEEN A CAR DEALERSHIP FOR THE LAST 22 YEARS.
• HAVE 6 BAYS ON THE BACK OF THE LOT
Listing Agents

MARK DORKARI
strongram58@gmail.com
strongram58@gmail.com
While we strive to provide the most accurate information, all listing information, and demographic data, is provided by third-parties. As such, MyEListing will not be responsible for the accuracy of the information. It is strongly recommended that you verify all information with the listing agent, and any relevant agencies, prior to making any decisions.