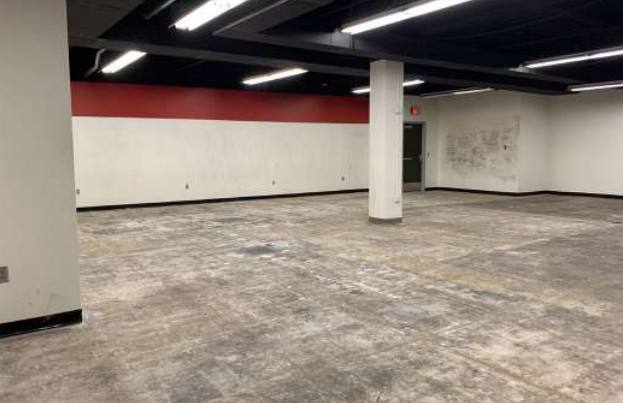
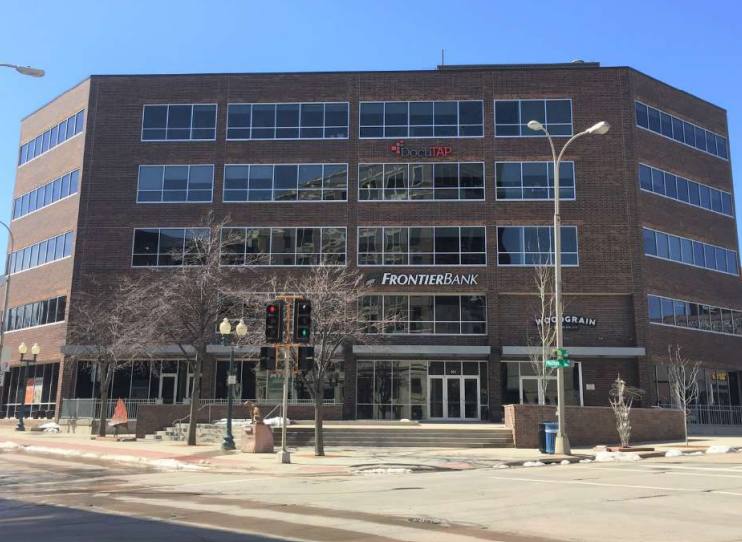
Office Space
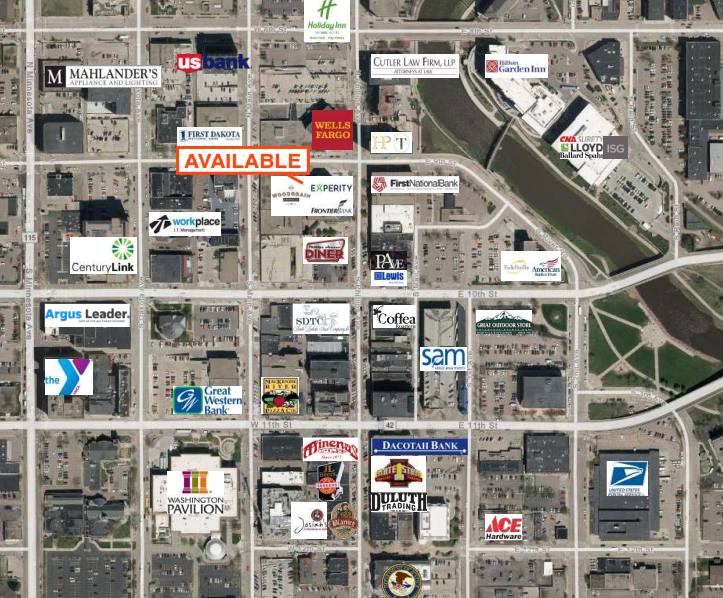
101 South Phillips Avenue Sioux Falls, SD 57104
101 South Phillips Avenue Sioux Falls, SD 57104
Details & Description
Property Highlights
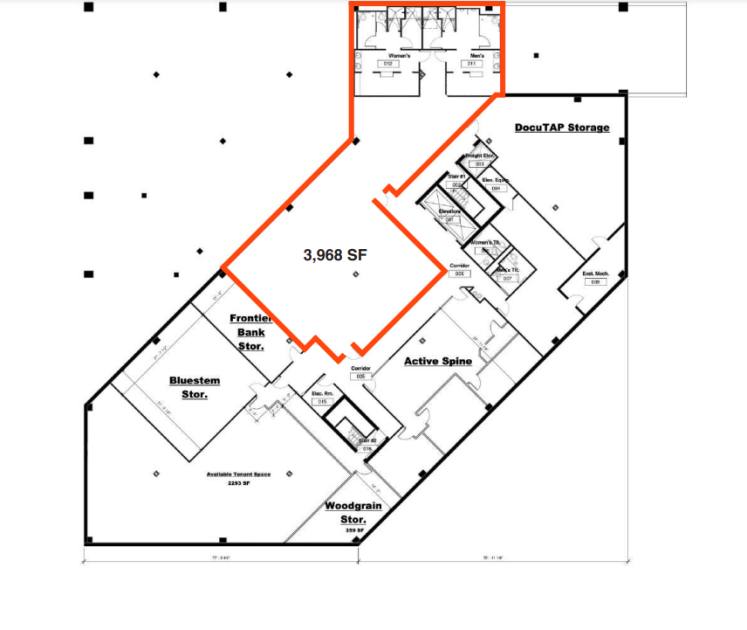
• Co-tenants include Frontier Bank, Woodgrain Brewing Company, Experity, Maguire Insurance Agency, Sterling Trustees
• Be part of the downtown vibrancy and professional tenant mix at The Plaza!
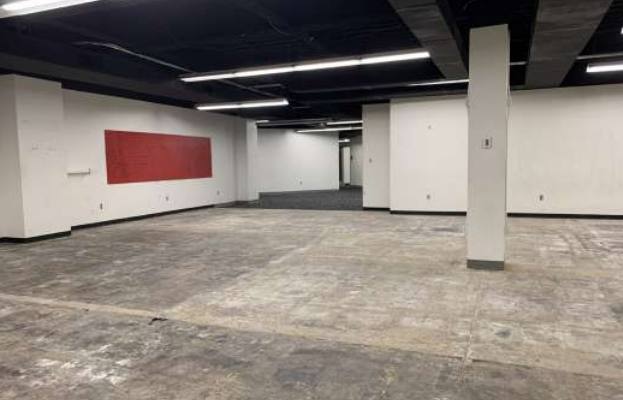
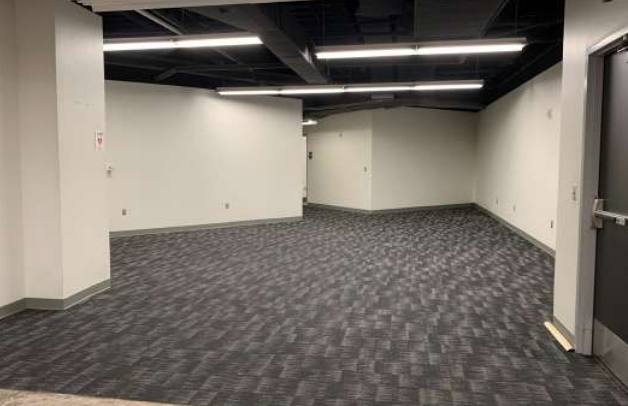
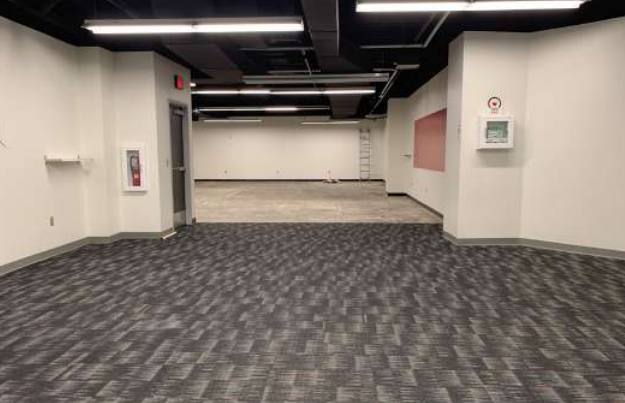
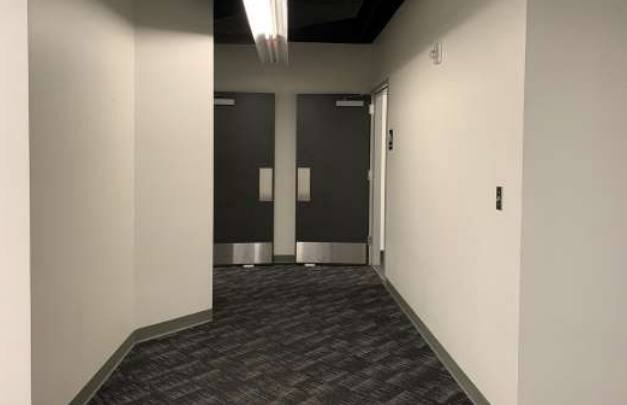
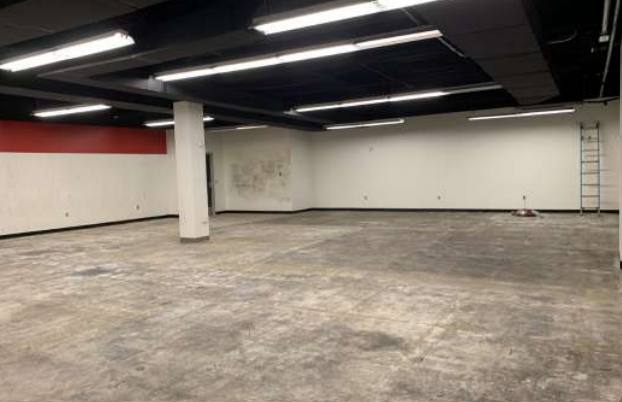
Additional Photos
Listing Agents

Raquel Blount
O: 605-728-9092
raquel@lloydcompanies.com
O: 605-728-9092
raquel@lloydcompanies.com
While we strive to provide the most accurate information, all listing information, and demographic data, is provided by third-parties. As such, MyEListing will not be responsible for the accuracy of the information. It is strongly recommended that you verify all information with the listing agent, and any relevant agencies, prior to making any decisions.