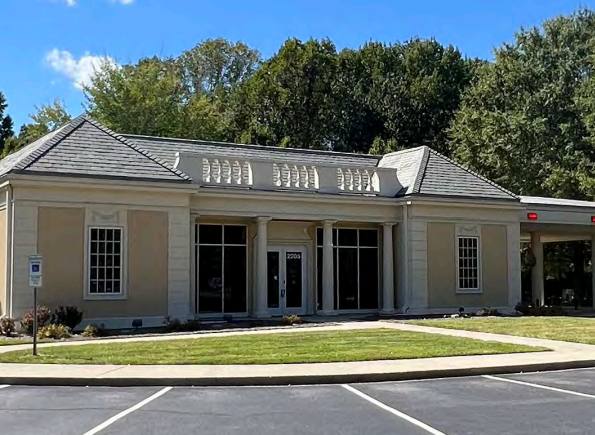
Retail Space
2205 Evans Road Cary, NC 27513
2205 Evans Road Cary, NC 27513
Details & Description
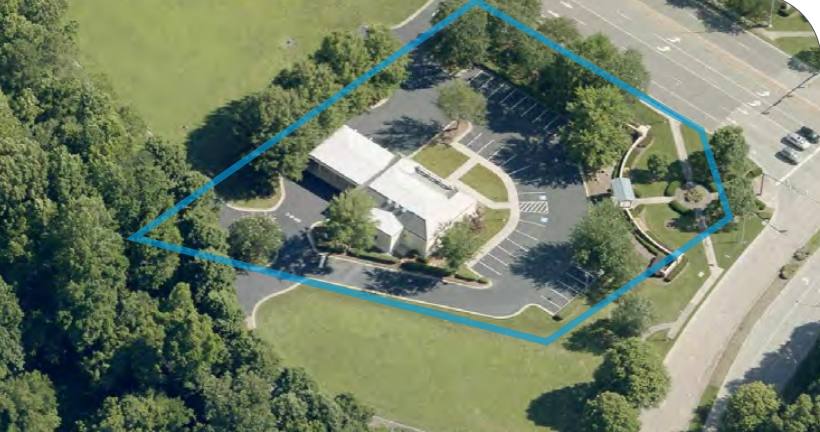
Property Highlights
- • 3,254 SF former First Citizens Bank branch
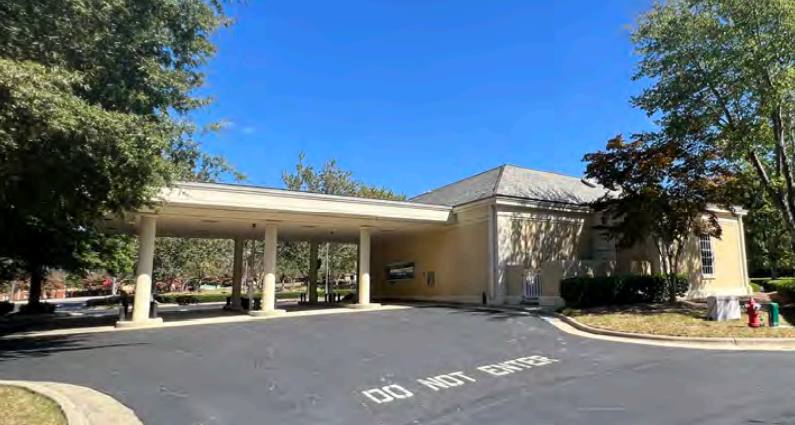
- • Drive-thru with 4 lanes
- • Excellent visibility
- • Abundant onsite parking
- • Zoned GC by the Town of Cary
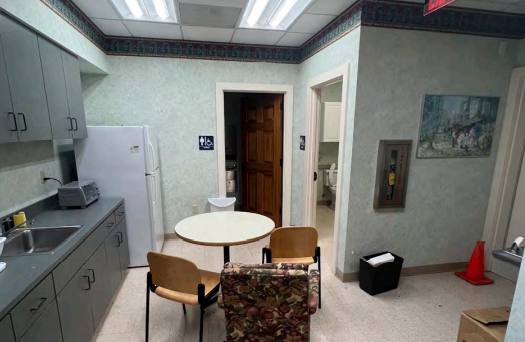
Additional Photos


Listing Agents

James Bailey
O: 919-576-2514
M: 336-602-3022
jbailey@lee-associates.com
O: 919-576-2514
M: 336-602-3022
jbailey@lee-associates.com
While we strive to provide the most accurate information, all listing information, and demographic data, is provided by third-parties. As such, MyEListing will not be responsible for the accuracy of the information. It is strongly recommended that you verify all information with the listing agent, and any relevant agencies, prior to making any decisions.