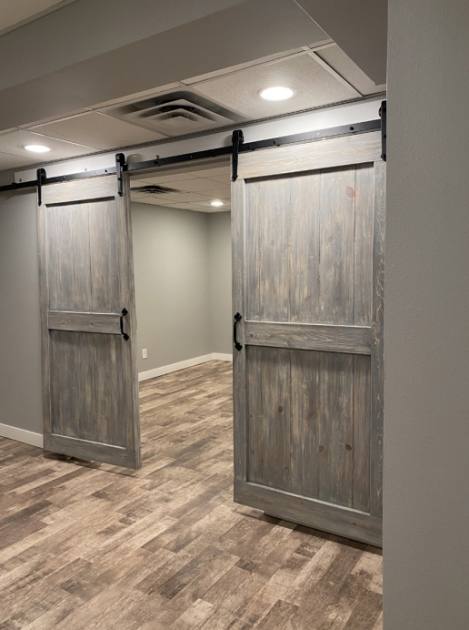
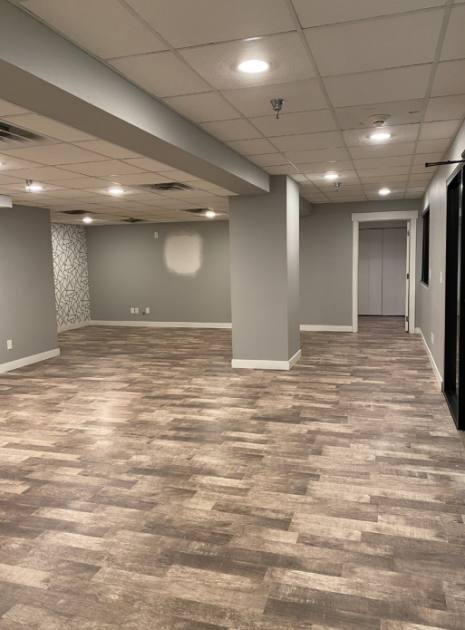
Office Space
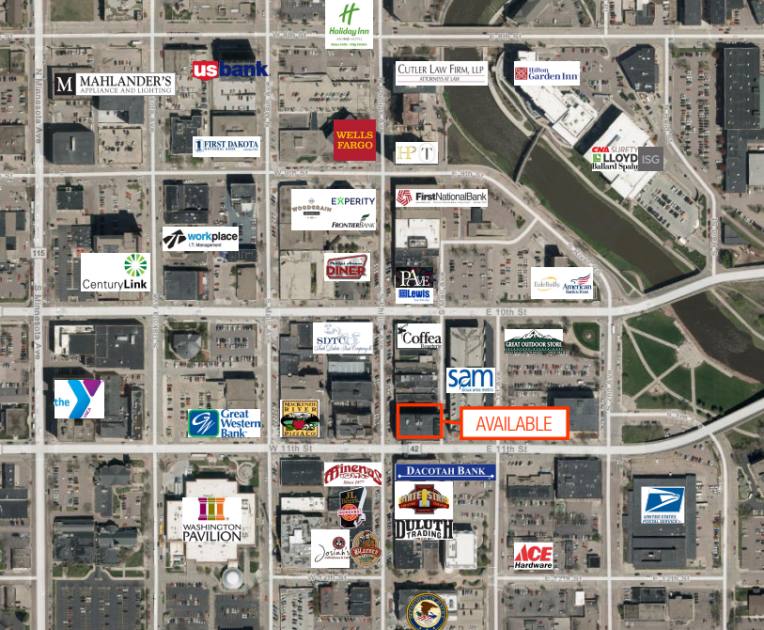
230 South Phillips Avenue Sioux Falls, SD 57104
230 South Phillips Avenue Sioux Falls, SD 57104
Details & Description
Property Highlights
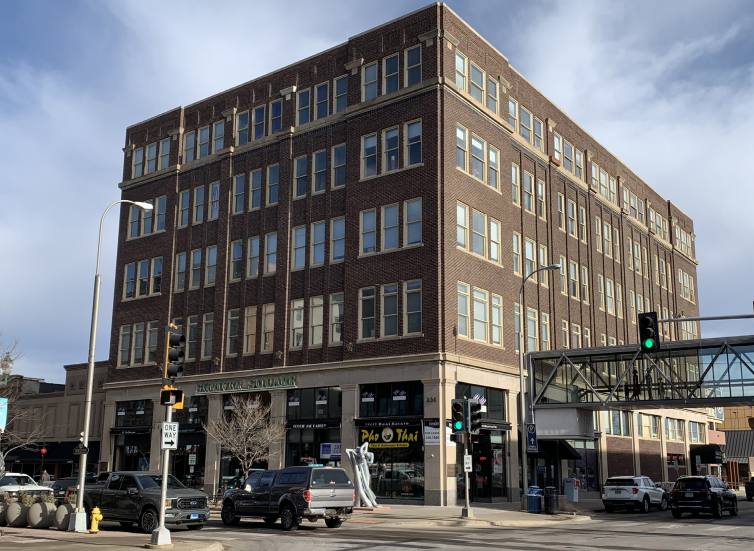
• Shriver Square tenants are the Cookie Jar, Pho Thai, Myers & Billion Law, Falls Real Estate and Green Acre Real Est
• Utilities: Water/Sewer, Gas, Electricity & Garbage are reimbursed by Tenant through CAM.
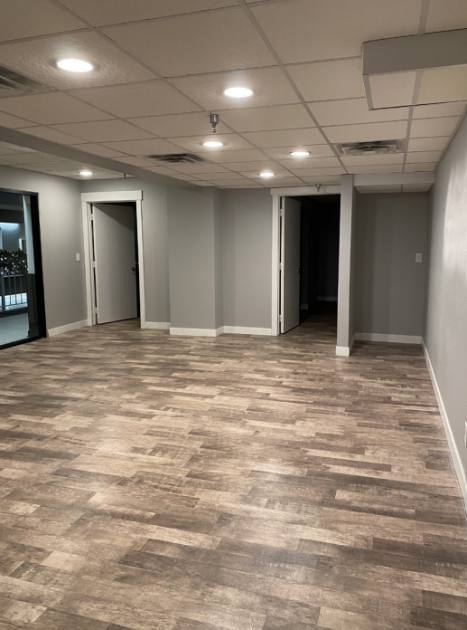
Additional Photos
Listing Agents

Raquel Blount
O: 605-728-9092
raquel@lloydcompanies.com
O: 605-728-9092
raquel@lloydcompanies.com
While we strive to provide the most accurate information, all listing information, and demographic data, is provided by third-parties. As such, MyEListing will not be responsible for the accuracy of the information. It is strongly recommended that you verify all information with the listing agent, and any relevant agencies, prior to making any decisions.