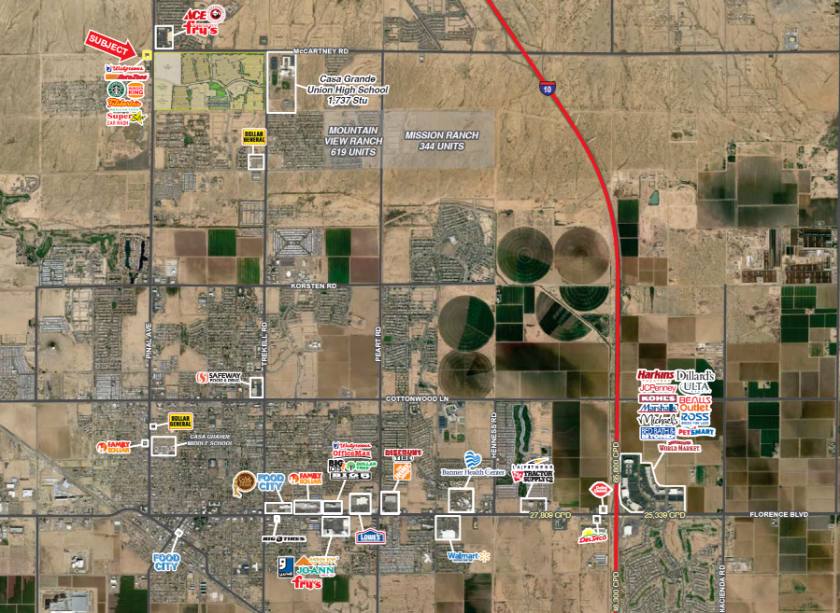
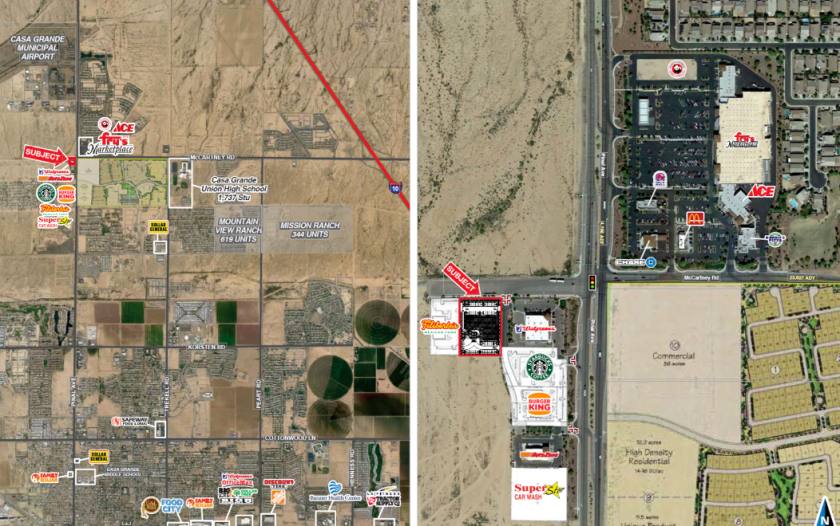
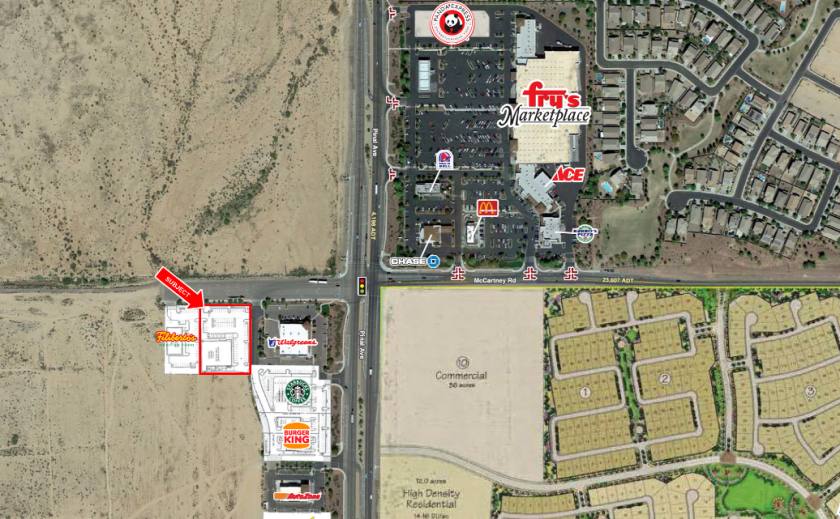
Commercial Land
465 East McCartney Road Casa Grande, AZ 85122
465 East McCartney Road Casa Grande, AZ 85122
Details & Description
Property Highlights
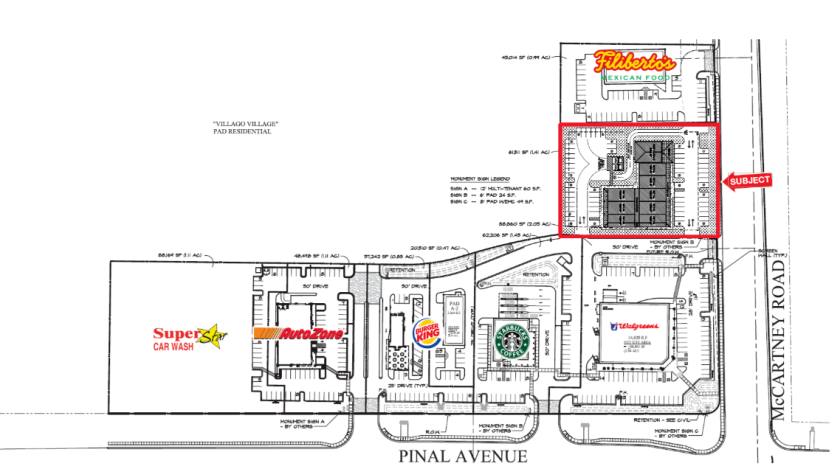
- • PAD Approved for Grocery
- • Shop space available
- • Drive-thru restaurant with patio opportunity
Additional Photos
Listing Agents

Bryan Ledbetter
O: 602-795-8670
bledbetter@w-retail.com
O: 602-795-8670
bledbetter@w-retail.com

Katie Weeks
O: 602-368-1372
kweeks@w-retail.com
O: 602-368-1372
kweeks@w-retail.com
While we strive to provide the most accurate information, all listing information, and demographic data, is provided by third-parties. As such, MyEListing will not be responsible for the accuracy of the information. It is strongly recommended that you verify all information with the listing agent, and any relevant agencies, prior to making any decisions.


