Commercial Land
La Mesa Dr 60th St N Sioux Falls Hartford, SD 57033
La Mesa Dr 60th St N Sioux Falls Hartford, SD 57033
Details & Description
Property Highlights
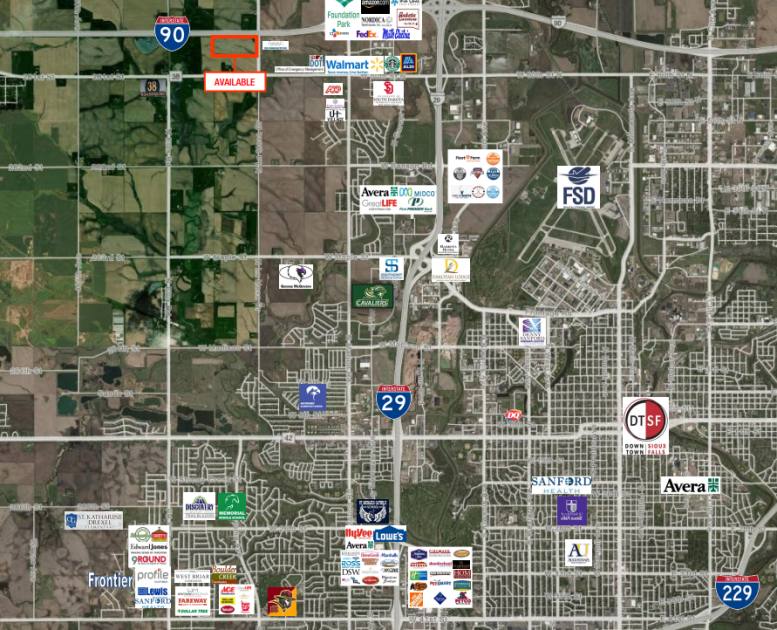
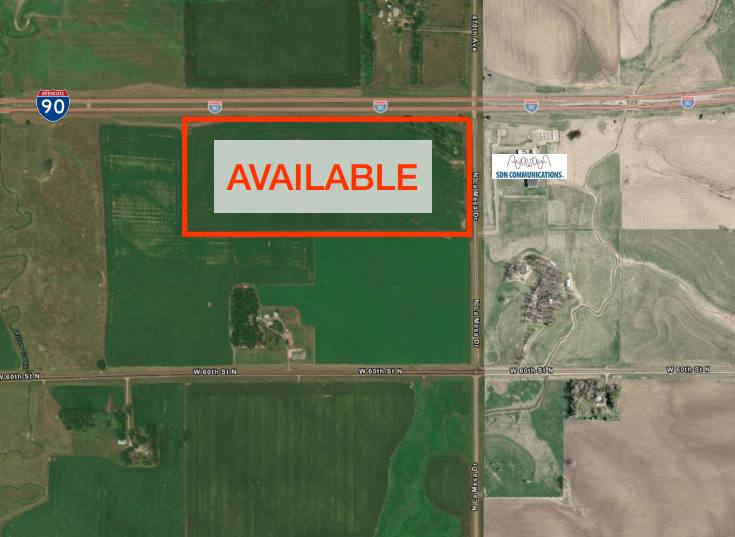
- • Easy access to I-90 and I-29
- • Zoning: Ag and located just outside of city limits
- • Located along a paved county highway
- • Currently not serviced with city water/sewer
Listing Agents

Raquel Blount
O: 605-728-9092
raquel@lloydcompanies.com
O: 605-728-9092
raquel@lloydcompanies.com
While we strive to provide the most accurate information, all listing information, and demographic data, is provided by third-parties. As such, MyEListing will not be responsible for the accuracy of the information. It is strongly recommended that you verify all information with the listing agent, and any relevant agencies, prior to making any decisions.