Industrial Properties
1515 South Brightleaf Boulevard Smithfield, NC 27577
1515 South Brightleaf Boulevard Smithfield, NC 27577
Details & Description
Property Highlights
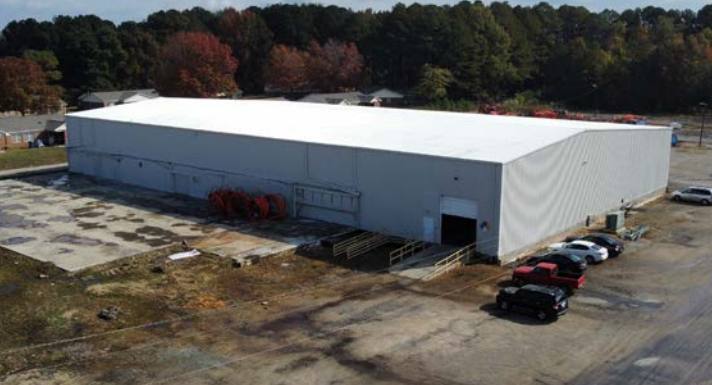
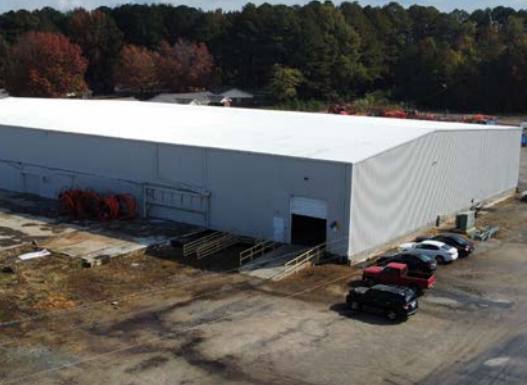
- • ±2 Acres Laydown yard
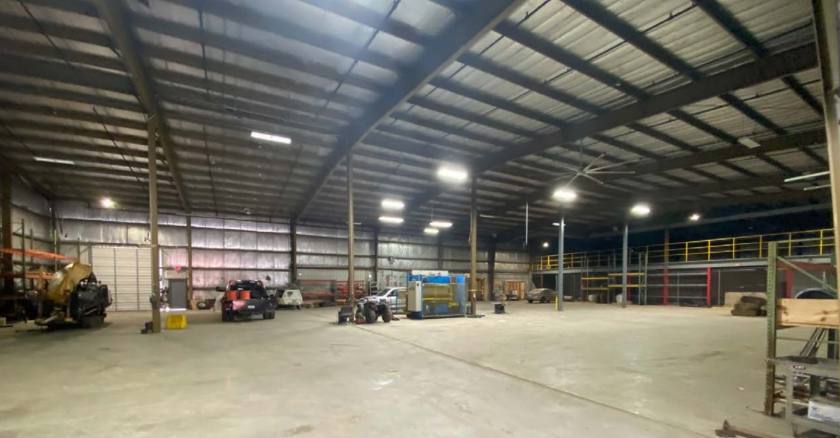
- • Column spacing: 24’ x 50’
- • 2 Drive-in doors with ramps
- • 4 Dock-high doors
- • Steel mezzanine
Listing Agents

Ryan Lawler
O: 919-576-2511
M: 949-291-3896
rlawler@lee-associates.com
O: 919-576-2511
M: 949-291-3896
rlawler@lee-associates.com

Will Judy
O: 919-576-2513
M: 919-606-1956
wjudy@lee-associates.com
O: 919-576-2513
M: 919-606-1956
wjudy@lee-associates.com
While we strive to provide the most accurate information, all listing information, and demographic data, is provided by third-parties. As such, MyEListing will not be responsible for the accuracy of the information. It is strongly recommended that you verify all information with the listing agent, and any relevant agencies, prior to making any decisions.