Commercial Land
2750 South Lorraine Place Sioux Falls, SD 57106
2750 South Lorraine Place Sioux Falls, SD 57106
Details & Description
Property Highlights
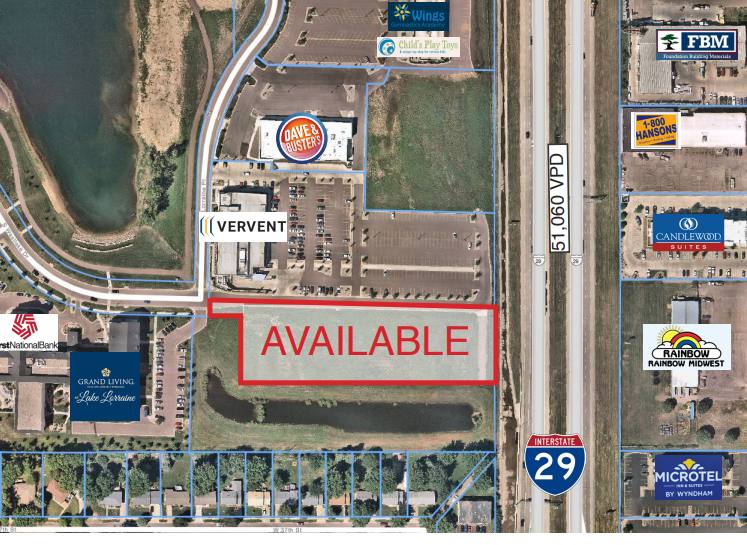
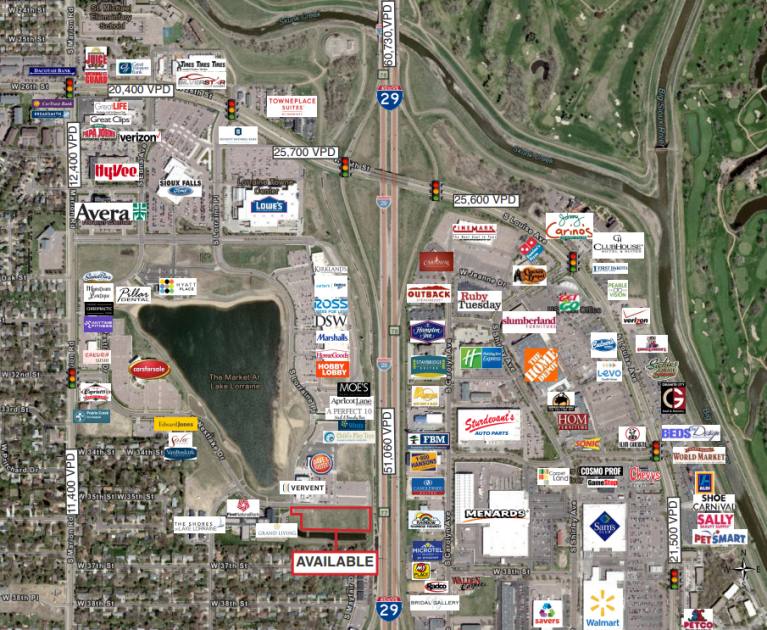
• Area neighbors: HobbyLobby, HomeGoods, Marshalls, Carter’s, DSW, Ross, Kirklands, Dave & Buster’s, Lowe
• Other neighbors: OshKosh B’gosh, Grand Living, Vervent, First National Bank and The Shores on Lake Lorraine
Additional Photos


Listing Agents

Raquel Blount
O: 605-728-9092
raquel@lloydcompanies.com
O: 605-728-9092
raquel@lloydcompanies.com
While we strive to provide the most accurate information, all listing information, and demographic data, is provided by third-parties. As such, MyEListing will not be responsible for the accuracy of the information. It is strongly recommended that you verify all information with the listing agent, and any relevant agencies, prior to making any decisions.


