Retail Space
5030 Glencrossing Way Cincinnati, OH 45238
5030 Glencrossing Way Cincinnati, OH 45238

Details & Description
Property Highlights
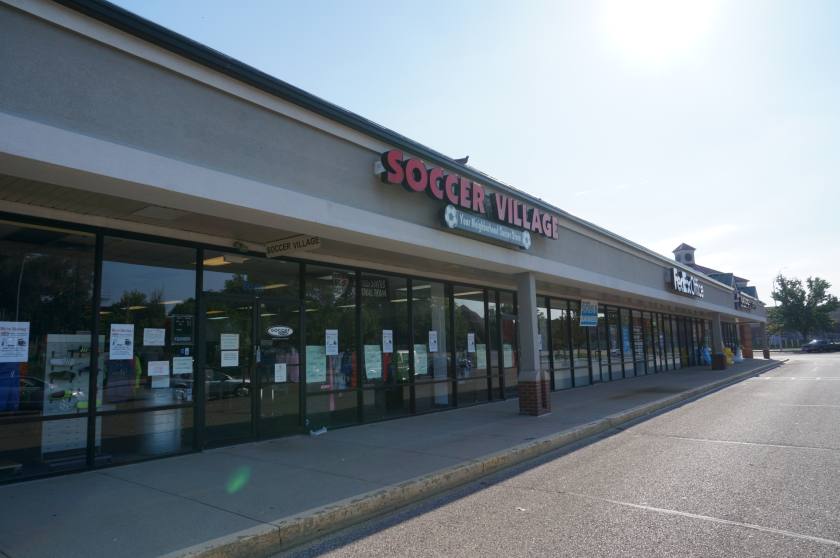
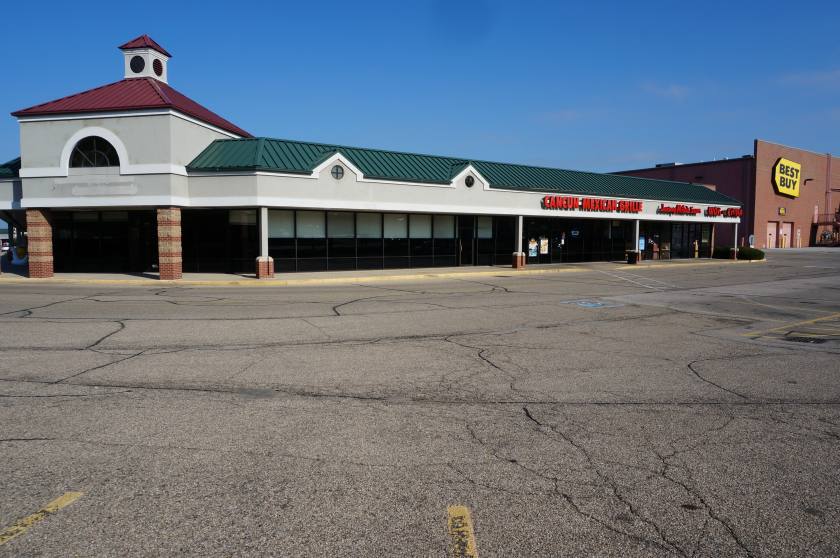
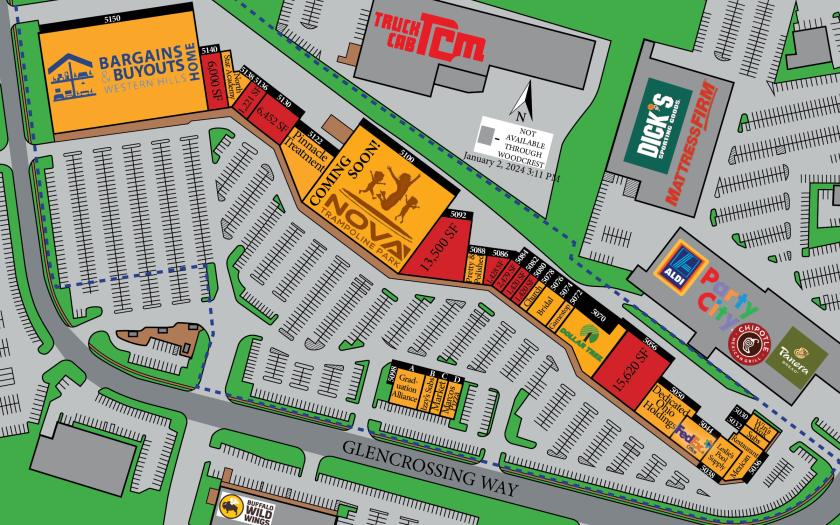
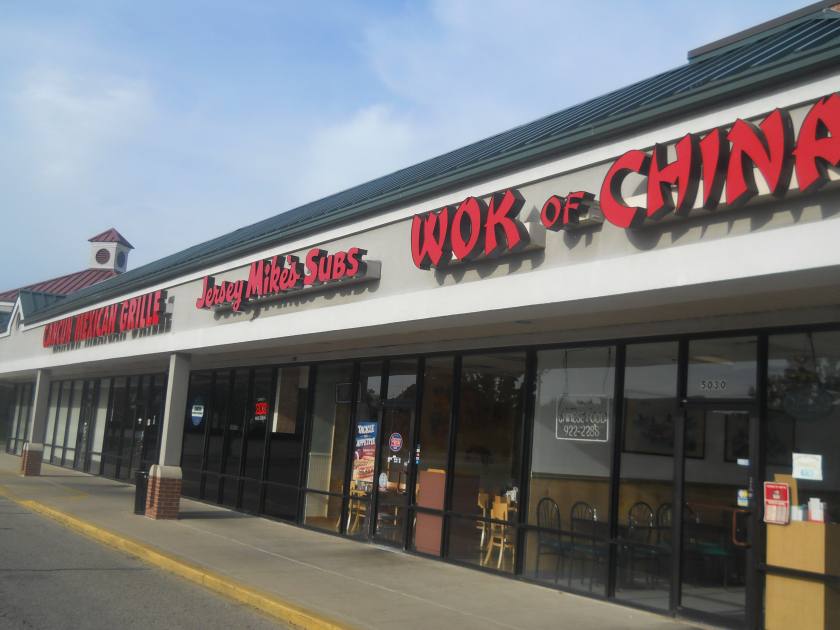
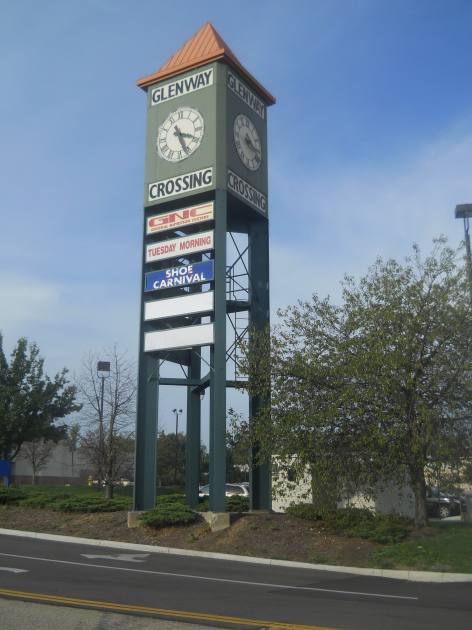
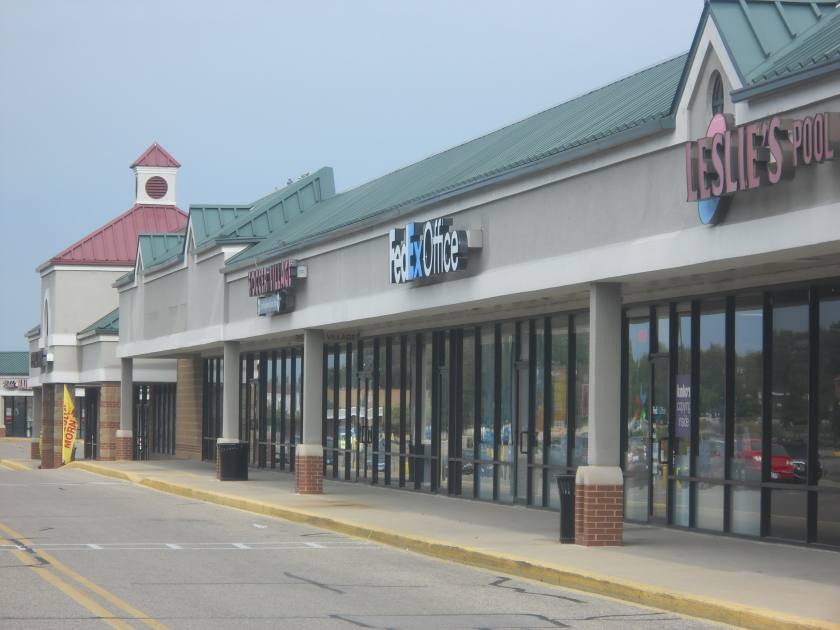
- • GLENCROSSING WAY SHOPPING CENTER
- • Strong Traffic & Population
- • Plenty of Parking
Additional Photos

Listing Agents

Cindy Metz
O: 513-322-6303
M: 513-207-3368
cmetz@bergmancommercial.com
O: 513-322-6303
M: 513-207-3368
cmetz@bergmancommercial.com
While we strive to provide the most accurate information, all listing information, and demographic data, is provided by third-parties. As such, MyEListing will not be responsible for the accuracy of the information. It is strongly recommended that you verify all information with the listing agent, and any relevant agencies, prior to making any decisions.