Office Space
1200 Riverplace Boulevard Jacksonville, FL 32207
1200 Riverplace Boulevard Jacksonville, FL 32207
Details & Description
Property Highlights
• Surrounded by a diverse mix of highrise office, residential neighborhoods, hotels, restaurants, and retail properties
• Unique building design featuring precast concrete panels and bronze tinted, double-pane glass windows
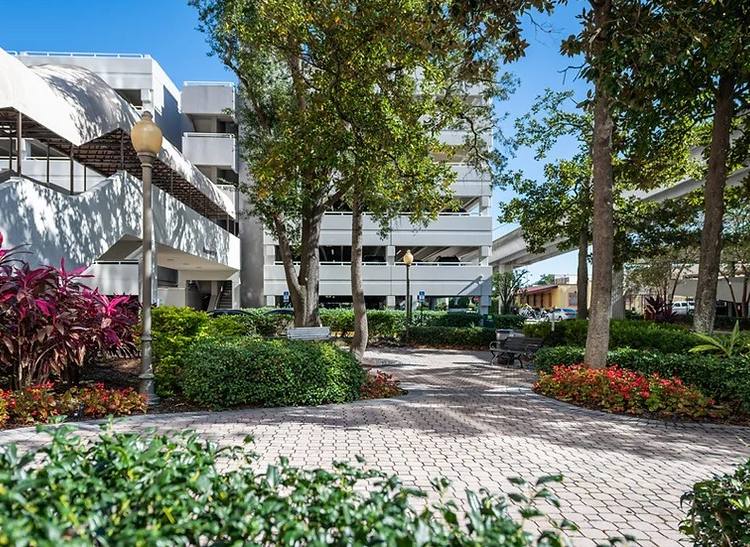
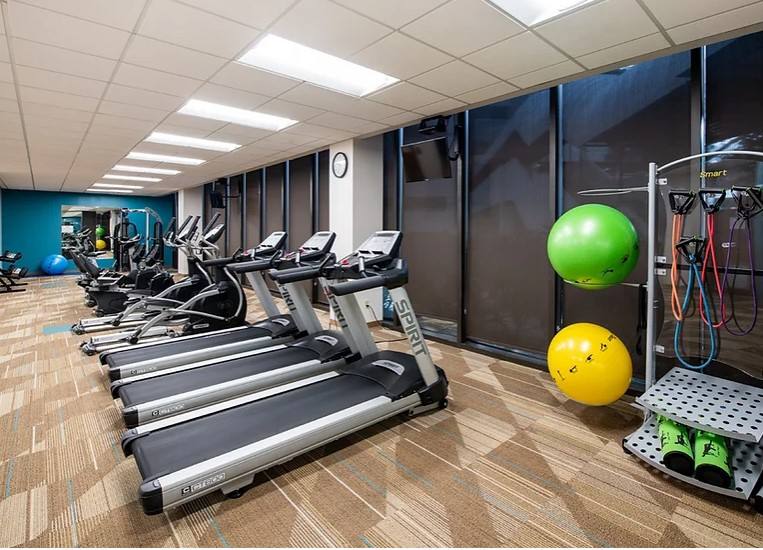
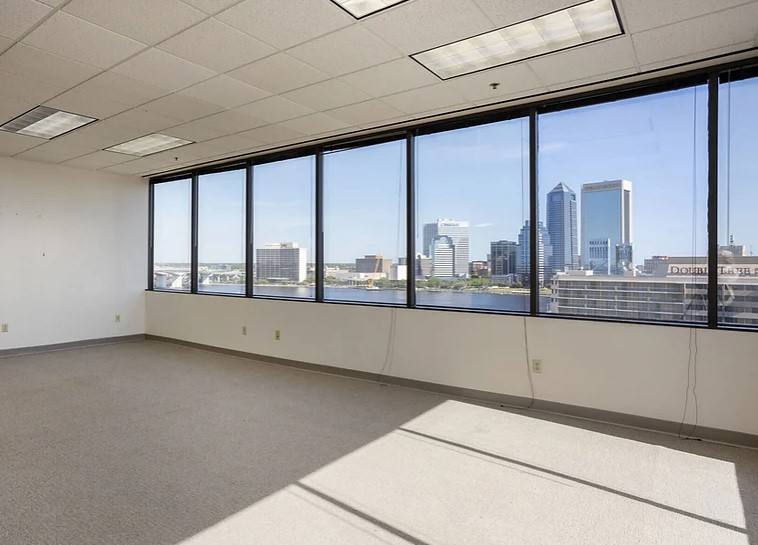
Additional Photos


Listing Agents

Jim Sebesta
O: 904-399-5222
M: 904-728-4515
jsebesta@phoenixrealty.net
O: 904-399-5222
M: 904-728-4515
jsebesta@phoenixrealty.net

Bryan Bartlett
O: 904-399-5222
M: 904-923-7959
bbartlett@phoenixrealty.net
O: 904-399-5222
M: 904-923-7959
bbartlett@phoenixrealty.net
While we strive to provide the most accurate information, all listing information, and demographic data, is provided by third-parties. As such, MyEListing will not be responsible for the accuracy of the information. It is strongly recommended that you verify all information with the listing agent, and any relevant agencies, prior to making any decisions.


