Commercial Land
3107 West Chandler Boulevard Chandler, AZ 85226
3107 West Chandler Boulevard Chandler, AZ 85226
Details & Description
Property Highlights
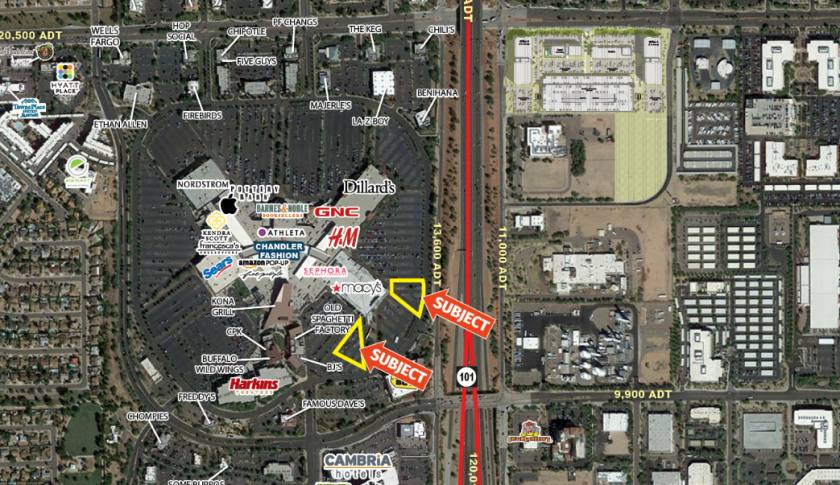
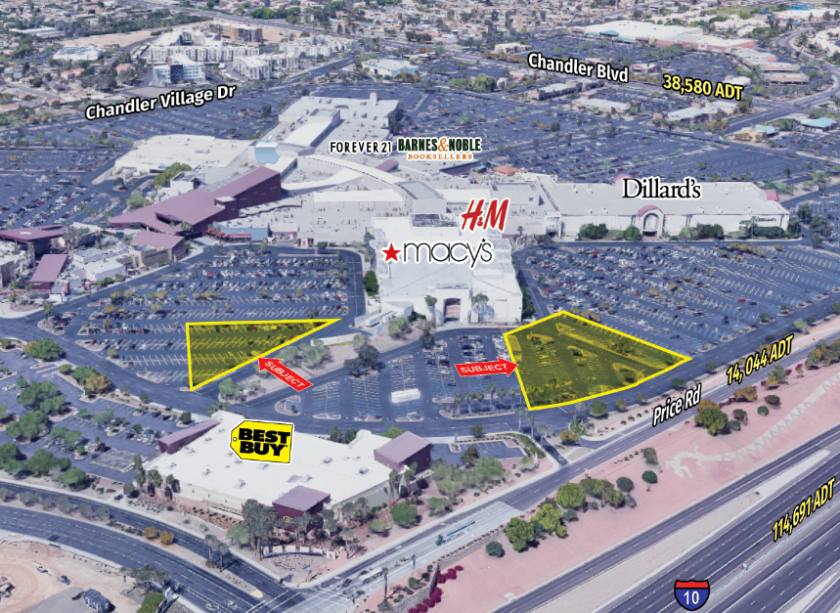
• Pads Available for build to suit, ground lease, or sale at strongly performing Chandler Fashion Center
• 1-2 Potential Pads Available developed by Macy's and United Growth in dominant Shopping Center
Listing Agents

Jake McClaughry
O: 602-368-1088
jmcclaughry@w-retail.com
O: 602-368-1088
jmcclaughry@w-retail.com

Ryan Desmond
O: 602-931-4489
rdesmond@w-retail.com
O: 602-931-4489
rdesmond@w-retail.com
While we strive to provide the most accurate information, all listing information, and demographic data, is provided by third-parties. As such, MyEListing will not be responsible for the accuracy of the information. It is strongly recommended that you verify all information with the listing agent, and any relevant agencies, prior to making any decisions.