Commercial Land
SWC Power Rd and Chandler Heights Rd Queen Creek, AZ 85142
SWC Power Rd and Chandler Heights Rd Queen Creek, AZ 85142
Details & Description
Property Highlights
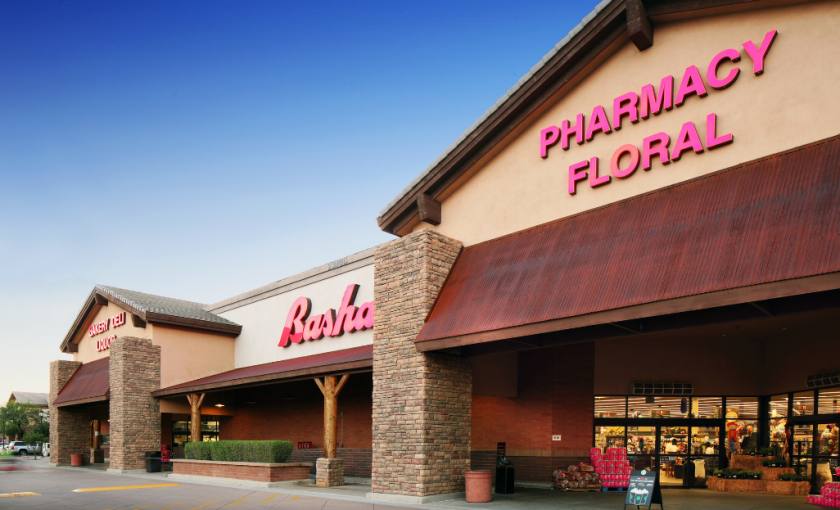
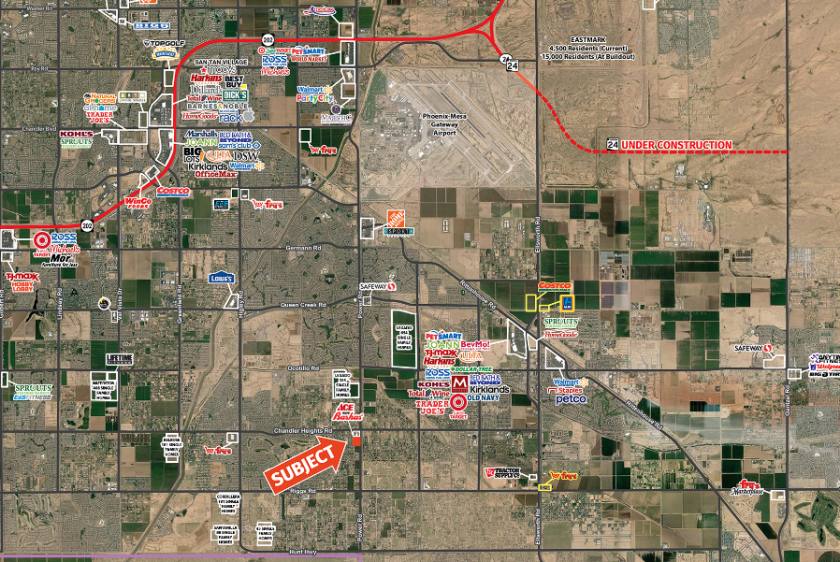
• Vibrant retail and residential market area - surrounded by high-income residential/golf communities
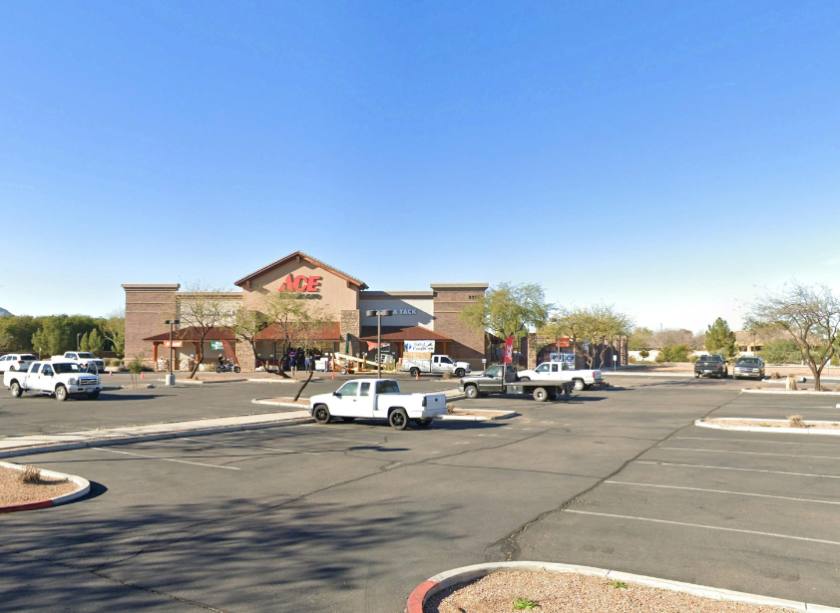
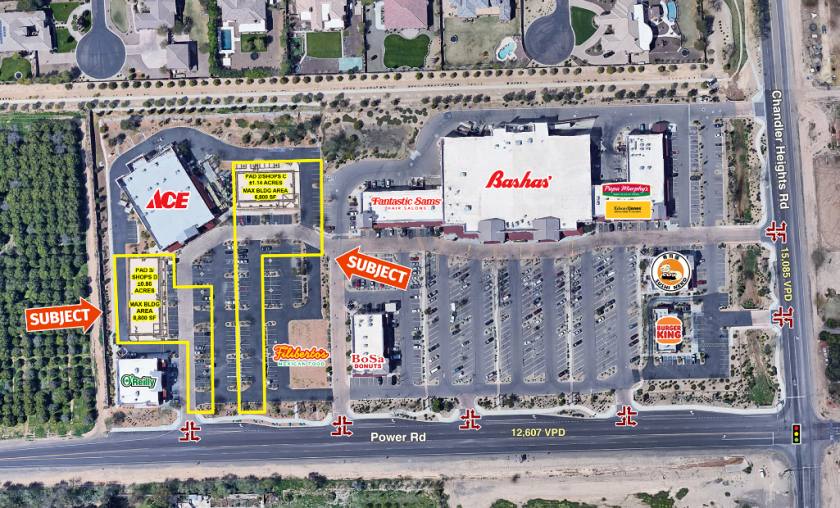
• Pads & Shop Space Available for Sale, Ground Lease or BTS in front of Ace Hardware
Additional Photos

Listing Agents

Bryan Ledbetter
O: 602-795-8670
bledbetter@w-retail.com
O: 602-795-8670
bledbetter@w-retail.com

Bryan Babits
O: 602-931-4491
bbabits@w-retail.com
O: 602-931-4491
bbabits@w-retail.com

Katie Weeks
O: 602-368-1372
kweeks@w-retail.com
O: 602-368-1372
kweeks@w-retail.com
While we strive to provide the most accurate information, all listing information, and demographic data, is provided by third-parties. As such, MyEListing will not be responsible for the accuracy of the information. It is strongly recommended that you verify all information with the listing agent, and any relevant agencies, prior to making any decisions.


