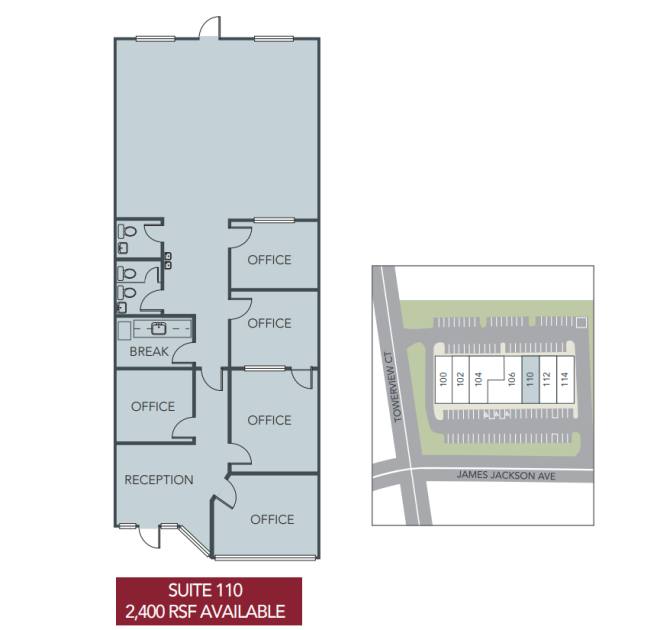
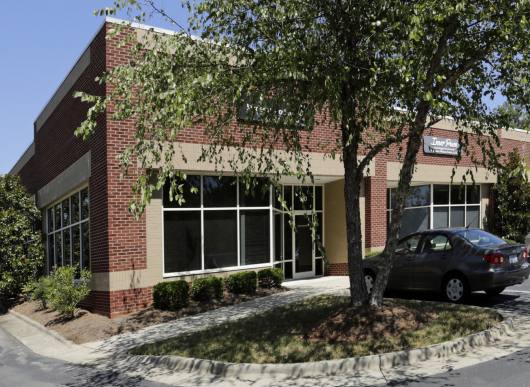
1-Mile | 3-Miles | 5-Miles | ||
---|---|---|---|---|
Total Population | 9,834 | 87,323 | 178,030 | |
Population Median Age | 39 | 38 | 37 | |
Population by Age | 0-9 Yrs | 1157 (11%) | 10978 (12%) | 22747 (12%) |
10-19 Yrs | 981 (9%) | 10954 (12%) | 22960 (12%) | |
20-29 Yrs | 1392 (14%) | 9958 (11%) | 22254 (12%) | |
30-39 Yrs | 1389 (14%) | 13986 (16%) | 27223 (15%) | |
40-49 Yrs | 1316 (13%) | 13856 (15%) | 28981 (16%) | |
50-59 Yrs | 1843 (18%) | 12253 (14%) | 24226 (13%) | |
60-69 Yrs | 1063 (10%) | 8854 (10%) | 17259 (9%) | |
70+ Yrs | 694 (7%) | 6484 (7%) | 12380 (6%) | |
Median HH Income | $99,940 | $95,318 | $97,826 | |
Total Household Income | < 24K | 457 (11%) | 2878 (8%) | 5090 (7%) |
25-49K | 428 (10%) | 5036 (14%) | 9891 (14%) | |
50-74K | 722 (17%) | 5515 (15%) | 10184 (14%) | |
75-99K | 412 (10%) | 4819 (13%) | 10087 (14%) | |
100-199K | 1058 (26%) | 10784 (31%) | 22365 (32%) | |
200K+ | 958 (23%) | 5659 (16%) | 11134 (16%) | |
Highest Education Level | No Diploma | 251 | 2267 | 4996 |
Diploma or GED | 656 | 6465 | 12469 | |
Some College | 1016 | 8319 | 15529 | |
Assoc. Degree | 351 | 4469 | 8892 | |
Bachelors Degree | 2747 | 23340 | 45915 | |
Higher Degree | 2070 | 16480 | 34523 | |
Total Housing Units | 4,393 | 36,854 | 72,938 | |
--Owner-Occupied | 2,069 | 20,541 | 41,731 | |
--Renter-Occupied | 1,964 | 14,151 | 27,022 | |
Owner-Occupied Values | < 100K | 9 | 423 | 948 |
100-199K | 170 | 2593 | 4217 | |
200-299K | 405 | 5626 | 10522 | |
300-399K | 391 | 5492 | 11514 | |
400-499K | 423 | 2671 | 6664 | |
500K+ | 671 | 3736 | 7865 | |
Total Working Age Population | 8,151 | 69,491 | 140,440 | |
In Work Force | 6,219 | 51,134 | 102,862 | |
Not In Work Force | 1,932 | 18,357 | 37,578 | |
Workforce Employed | 6,009 | 49,307 | 99,599 | |
Workforce Unemployed | 206 | 1,741 | 3,136 | |
Civlian Workforce | 6,215 | 51,047 | 102,735 | |
Military Workforce | 4 | 87 | 127 | |
Total Households | 4,033 | 34,691 | 68,753 | |
Family Households | 2,519 | 23,206 | 46,744 | |
Non-Family Households | 1,514 | 11,486 | 22,009 | |
Married Couple | 2,145 | 18,915 | 38,529 | |
Other Family | 374 | 4,291 | 8,215 | |
Married w/Child | 896 | 8,618 | 18,647 | |
Single Male w/Child | 55 | 928 | 1,695 | |
Single Female w/Child | 105 | 1,531 | 3,050 |
Population Change Last Two Decades - Plus Projection
2000 | % | 2010 | % | 2020 | % | 2030 | |
---|---|---|---|---|---|---|---|
North Carolina | 8,049,313 | +18 | 9,535,483 | +11 | 10,630,691 | +11 | 11,836,070 |
Wake County | 627,846 | +44 | 900,993 | +23 | 1,109,883 | +20 | 1,328,336 |
Durham County | 223,314 | +20 | 267,587 | +20 | 320,322 | +14 | 366,111 |
Total Working Age Population:
Total Households:
Total Working Age Population:
Total Households:
Total Working Age Population:
Total Households: