Commercial Land
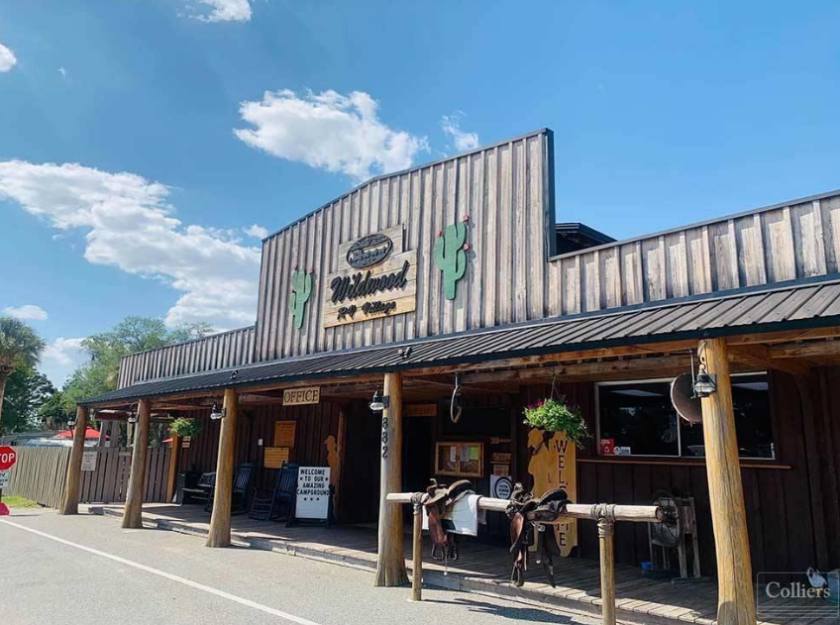
882 East SR 44 Wildwood, FL 34785
882 East SR 44 Wildwood, FL 34785
Details & Description
Property Highlights
- • Public Water / Public Sewer
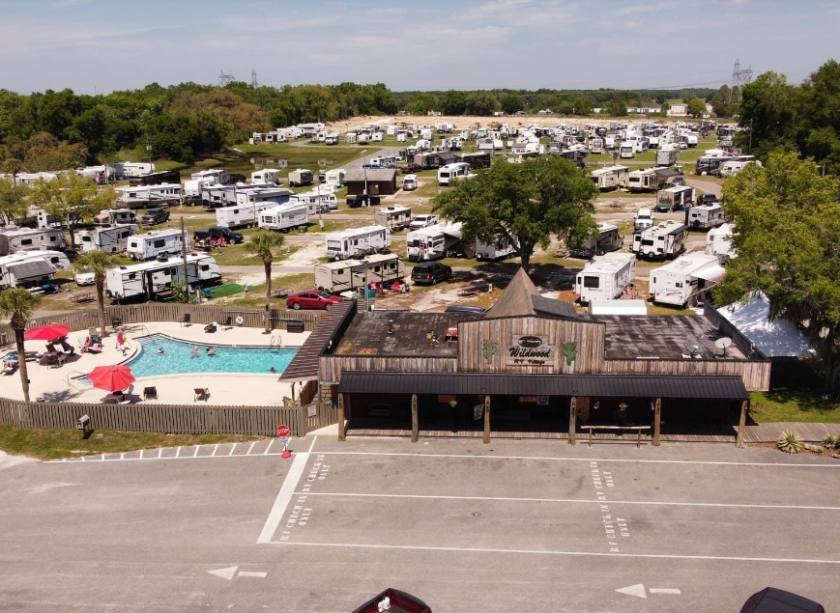
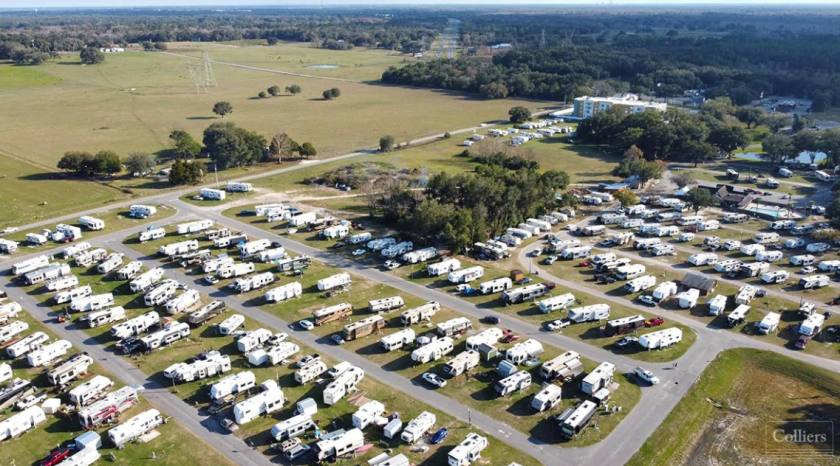
- • 130+ site RV Expansion Opportunity
- • 9.0 / 10.0 / 8.0 Good Sam Rating
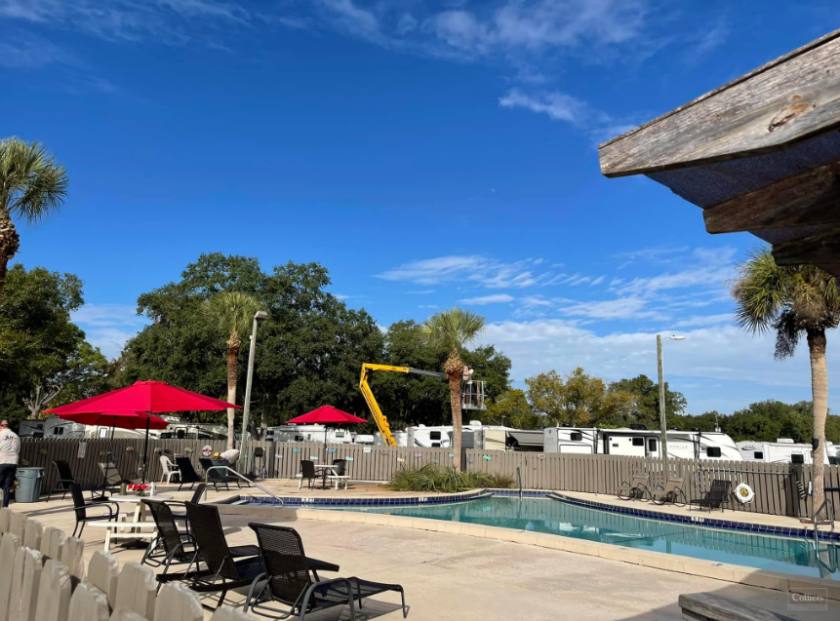
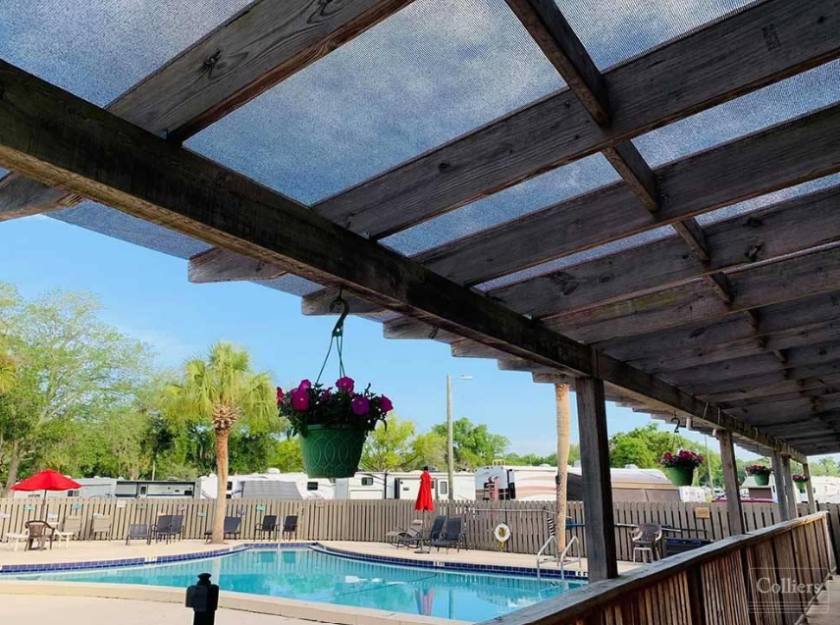
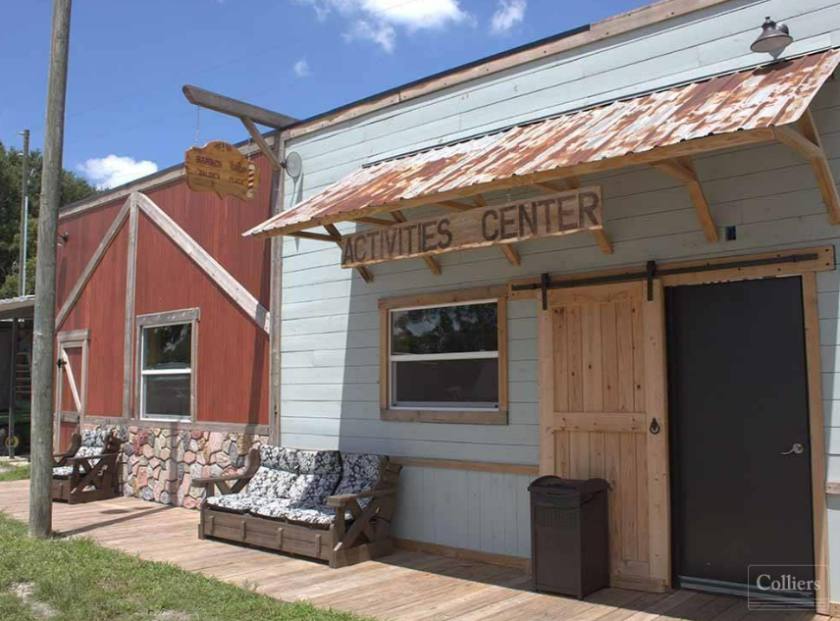
- • 11.34 Acres Commercial Land available for sale
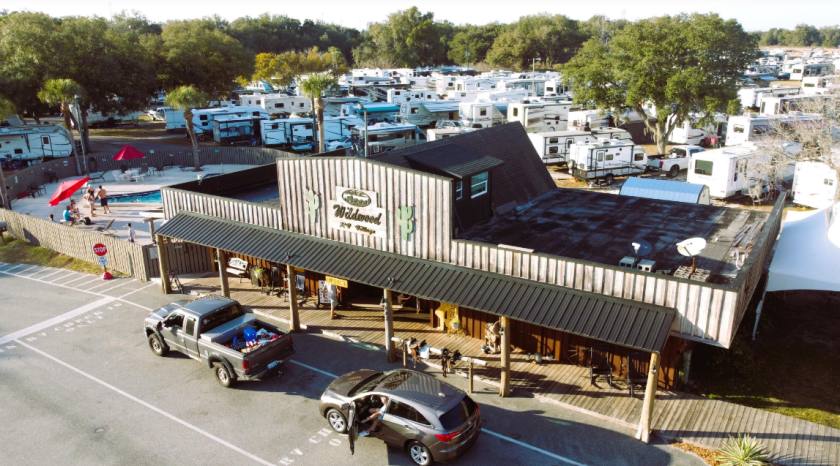
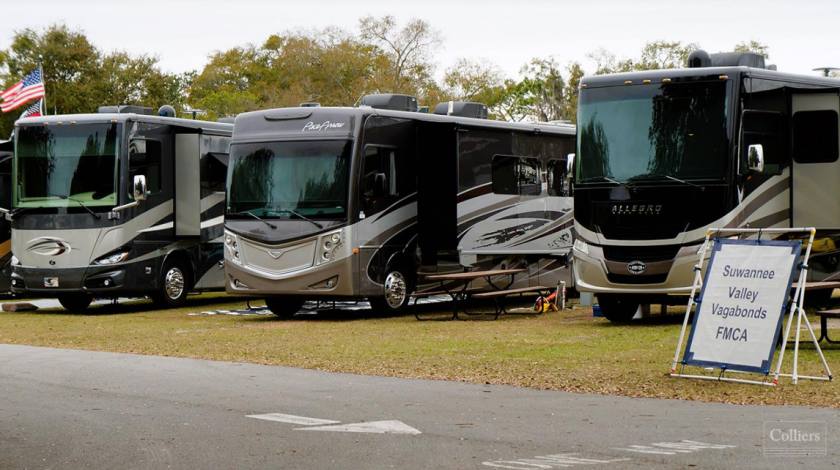
Additional Photos

Listing Agents

Michael Nissley
O: 561-479-1588
M: 561-479-1588
Mike.Nissley@colliers.com
O: 561-479-1588
M: 561-479-1588
Mike.Nissley@colliers.com
While we strive to provide the most accurate information, all listing information, and demographic data, is provided by third-parties. As such, MyEListing will not be responsible for the accuracy of the information. It is strongly recommended that you verify all information with the listing agent, and any relevant agencies, prior to making any decisions.