Office Space
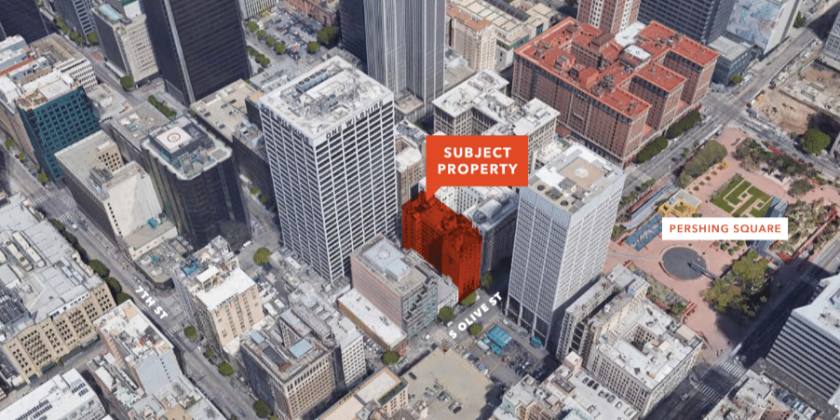
617 South Olive Street Los Angeles, CA 90014
617 South Olive Street Los Angeles, CA 90014
Details & Description
Property Highlights
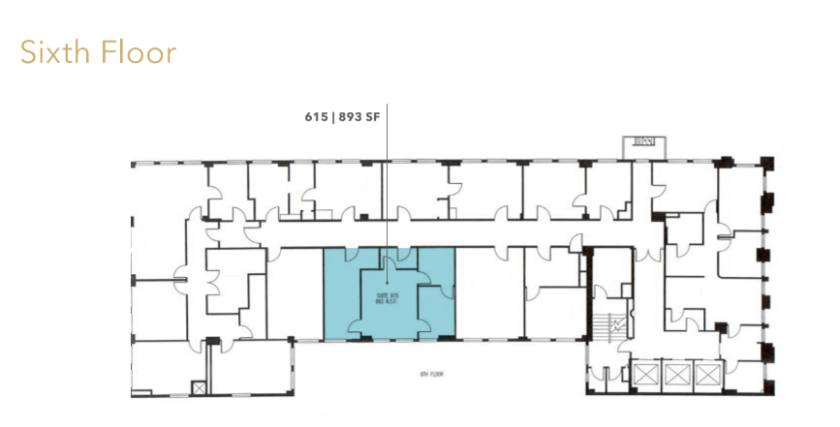
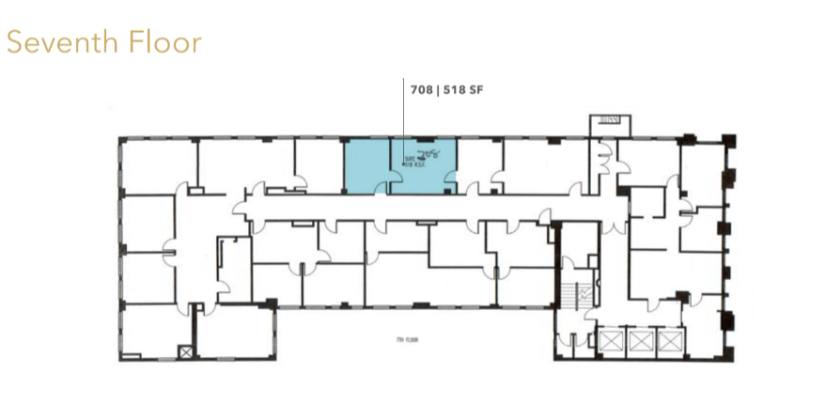
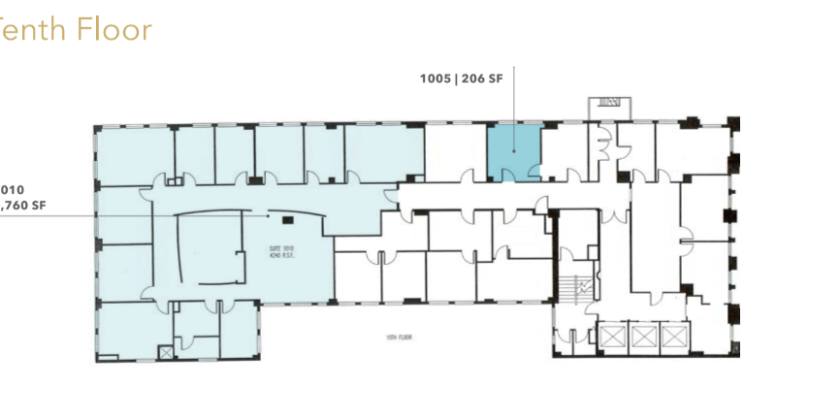
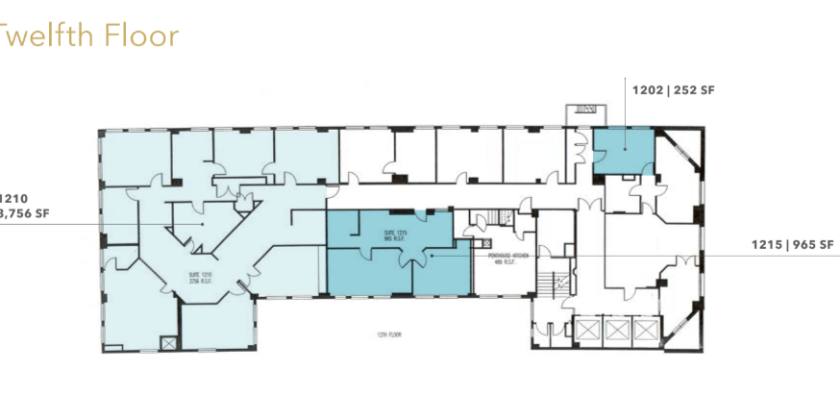
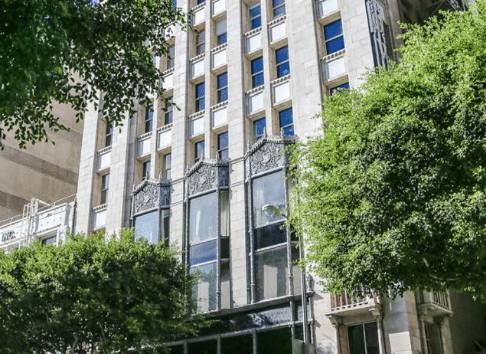
- • HISTORIC highrise with move-in ready suites
- • CREATIVE and traditional office space location
- • SECURED key card elevator access
- • PENTHOUSE and ground floor restaurant
Additional Photos
Listing Agents

John Anthony
O: 213-225-7218
M: 213-507-5570
john.anthony@kidder.com
O: 213-225-7218
M: 213-507-5570
john.anthony@kidder.com

Christopher Steck
O: 213-225-7231
christopher.steck@kidder.com
O: 213-225-7231
christopher.steck@kidder.com

Christopher Giordano
Kidder Mathews
O: 213-225-7219
christopher.giordano@kidder.com
Kidder Mathews
O: 213-225-7219
christopher.giordano@kidder.com
While we strive to provide the most accurate information, all listing information, and demographic data, is provided by third-parties. As such, MyEListing will not be responsible for the accuracy of the information. It is strongly recommended that you verify all information with the listing agent, and any relevant agencies, prior to making any decisions.