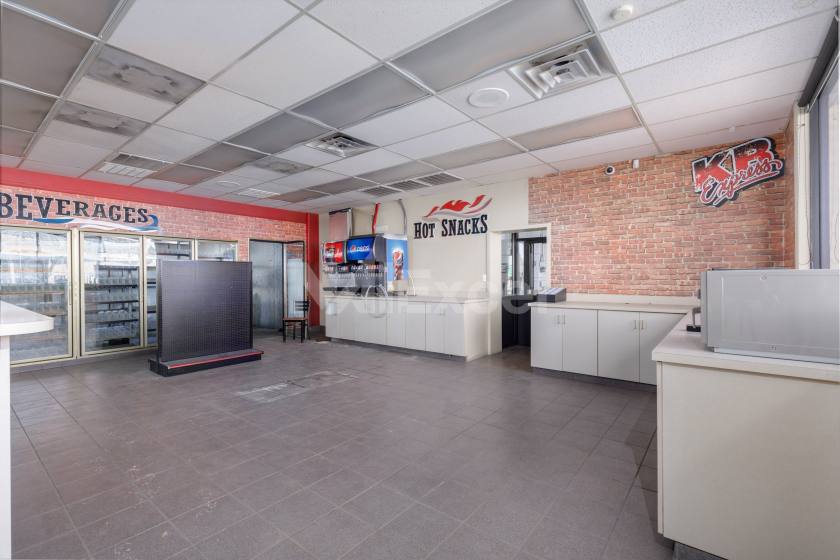
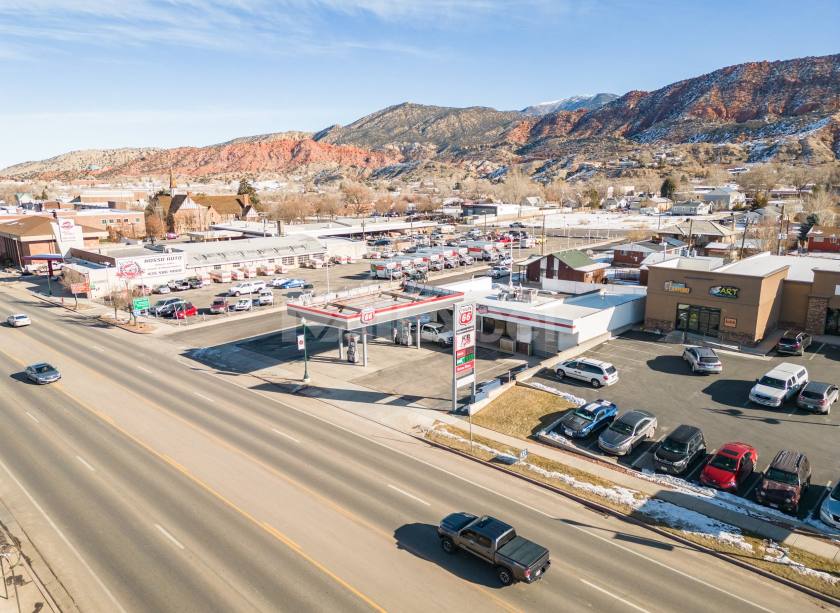
1-Mile | 3-Miles | 5-Miles | ||
---|---|---|---|---|
Total Population | 6,935 | 25,146 | 33,143 | |
Population Median Age | 32 | 32 | 32 | |
Population by Age | 0-9 Yrs | 705 (10%) | 3759 (14%) | 5094 (15%) |
10-19 Yrs | 1185 (17%) | 4464 (17%) | 5835 (17%) | |
20-29 Yrs | 2350 (33%) | 6079 (24%) | 7144 (21%) | |
30-39 Yrs | 739 (10%) | 2711 (10%) | 3956 (11%) | |
40-49 Yrs | 647 (9%) | 2321 (9%) | 3138 (9%) | |
50-59 Yrs | 373 (5%) | 2029 (8%) | 2802 (8%) | |
60-69 Yrs | 392 (5%) | 1989 (7%) | 2889 (8%) | |
70+ Yrs | 542 (7%) | 1794 (7%) | 2284 (6%) | |
Median HH Income | $36,316 | $49,448 | $52,460 | |
Total Household Income | < 24K | 890 (34%) | 2138 (25%) | 2542 (23%) |
25-49K | 840 (32%) | 2123 (25%) | 2762 (25%) | |
50-74K | 453 (17%) | 1600 (18%) | 2208 (20%) | |
75-99K | 194 (7%) | 1085 (12%) | 1498 (13%) | |
100-199K | 227 (8%) | 1374 (16%) | 1812 (16%) | |
200K+ | 6 (0%) | 121 (1%) | 193 (1%) | |
Highest Education Level | No Diploma | 223 | 706 | 993 |
Diploma or GED | 857 | 2974 | 4025 | |
Some College | 1133 | 3767 | 5307 | |
Assoc. Degree | 292 | 1121 | 1569 | |
Bachelors Degree | 597 | 2993 | 3985 | |
Higher Degree | 300 | 1364 | 1866 | |
Total Housing Units | 3,143 | 9,593 | 12,367 | |
--Owner-Occupied | 929 | 4,438 | 6,322 | |
--Renter-Occupied | 1,680 | 4,003 | 4,693 | |
Owner-Occupied Values | < 100K | 137 | 339 | 426 |
100-199K | 371 | 1290 | 1898 | |
200-299K | 359 | 1603 | 2238 | |
300-399K | 44 | 855 | 1221 | |
400-499K | 4 | 218 | 315 | |
500K+ | 14 | 134 | 224 | |
Total Working Age Population | 5,628 | 19,273 | 25,111 | |
In Work Force | 3,544 | 12,053 | 15,908 | |
Not In Work Force | 2,084 | 7,220 | 9,203 | |
Workforce Employed | 3,345 | 11,380 | 15,066 | |
Workforce Unemployed | 188 | 661 | 825 | |
Civlian Workforce | 3,533 | 12,042 | 15,891 | |
Military Workforce | 11 | 11 | 16 | |
Total Households | 2,608 | 8,441 | 11,015 | |
Family Households | 1,460 | 5,618 | 7,766 | |
Non-Family Households | 1,149 | 2,823 | 3,249 | |
Married Couple | 969 | 4,304 | 6,132 | |
Other Family | 491 | 1,314 | 1,634 | |
Married w/Child | 419 | 1,870 | 2,792 | |
Single Male w/Child | 145 | 310 | 360 | |
Single Female w/Child | 151 | 594 | 709 |
Population Change Last Two Decades - Plus Projection
2000 | % | 2010 | % | 2020 | % | 2030 | |
---|---|---|---|---|---|---|---|
Utah | 2,233,169 | +24 | 2,763,885 | +20 | 3,325,425 | +17 | 3,889,310 |
Iron County | 33,779 | +37 | 46,163 | +19 | 55,056 | +16 | 63,898 |
Total Working Age Population:
Total Households:
Total Working Age Population:
Total Households:
Total Working Age Population:
Total Households: