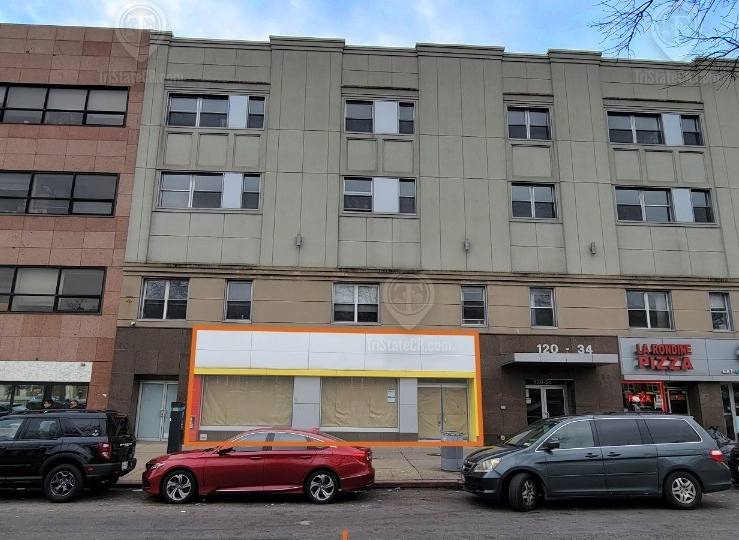
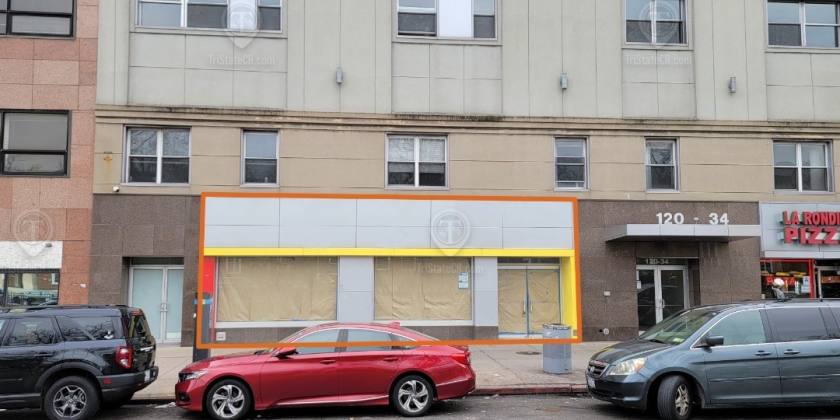
Retail Space
120-34 Queens Boulevard Queens, NY 11415
120-34 Queens Boulevard Queens, NY 11415
Details & Description
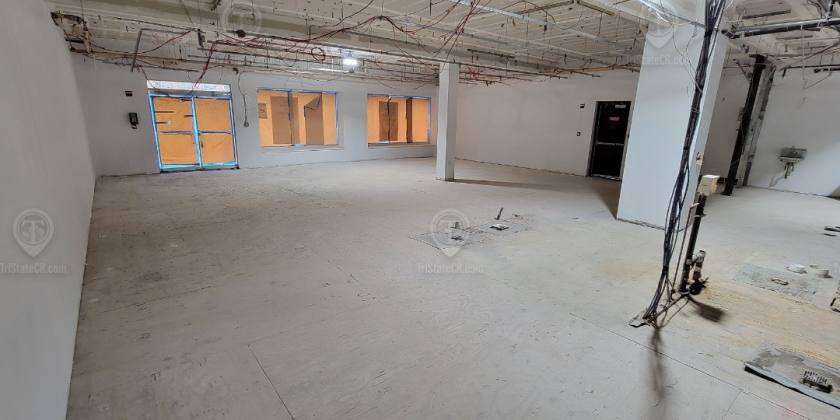
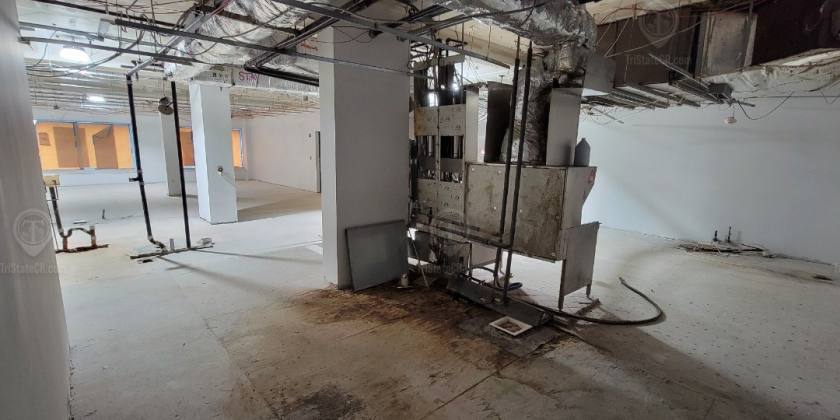
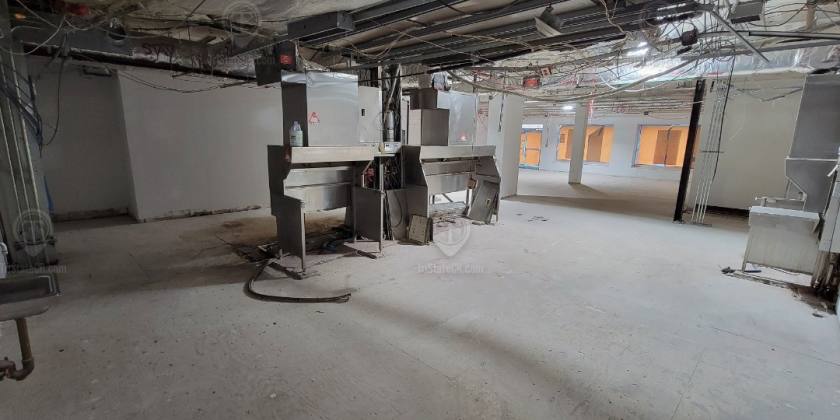
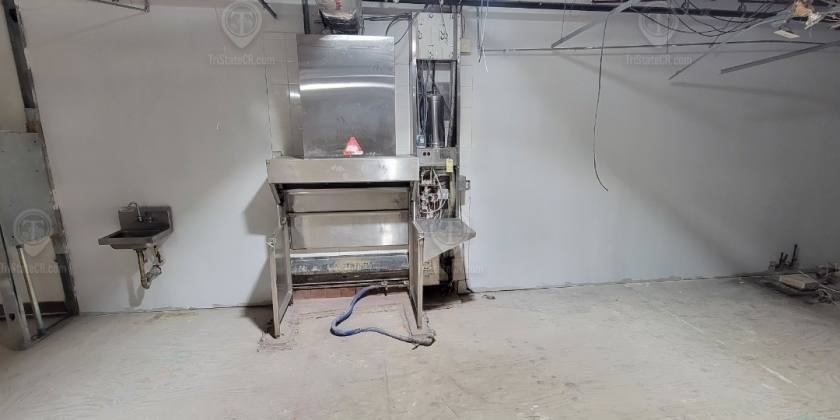
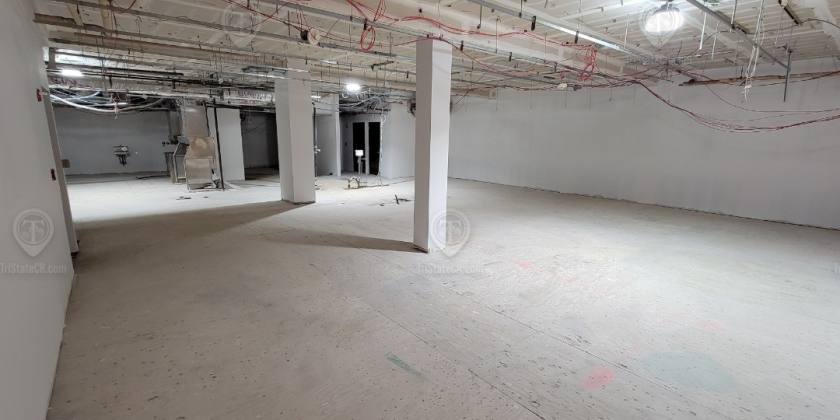
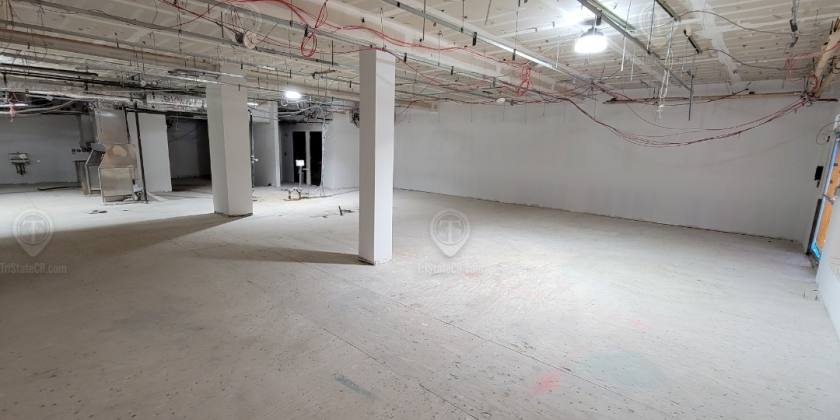
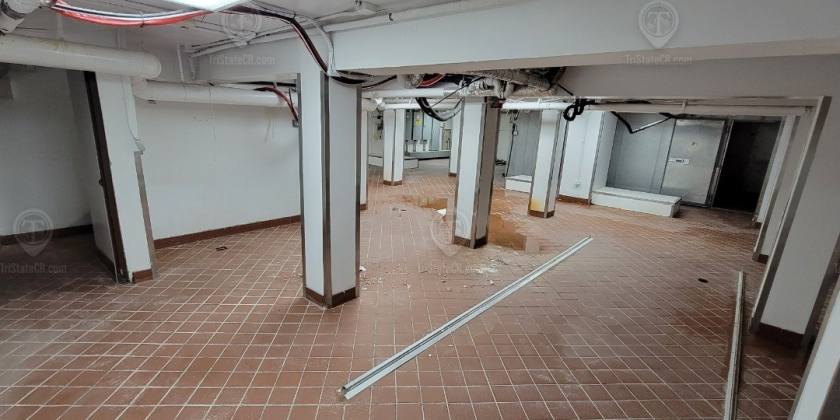
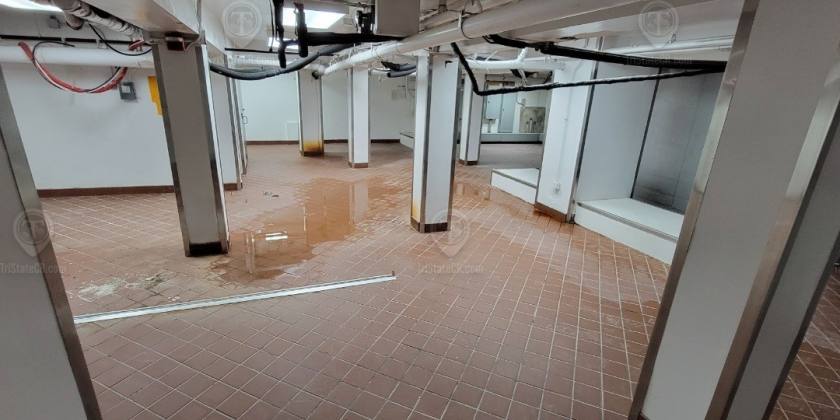
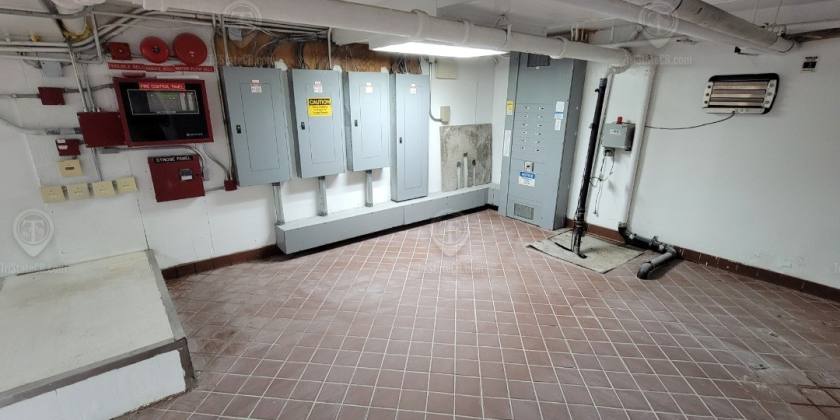
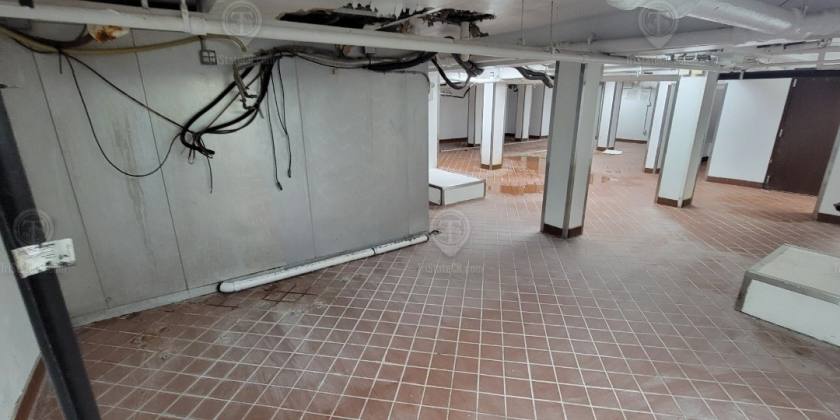
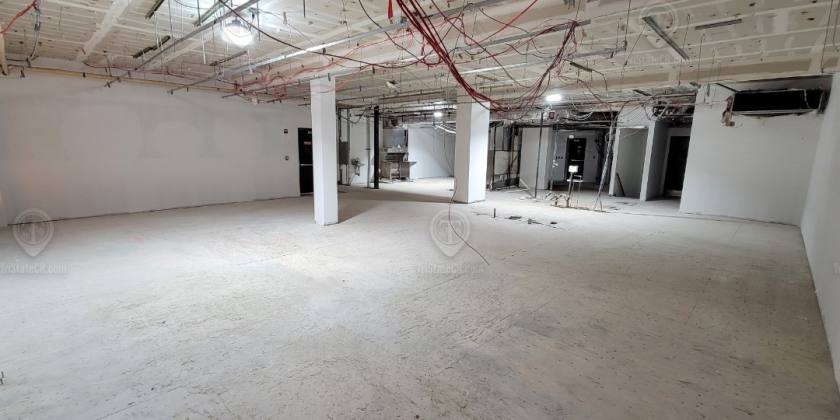
Property Highlights
- • Venting in-place
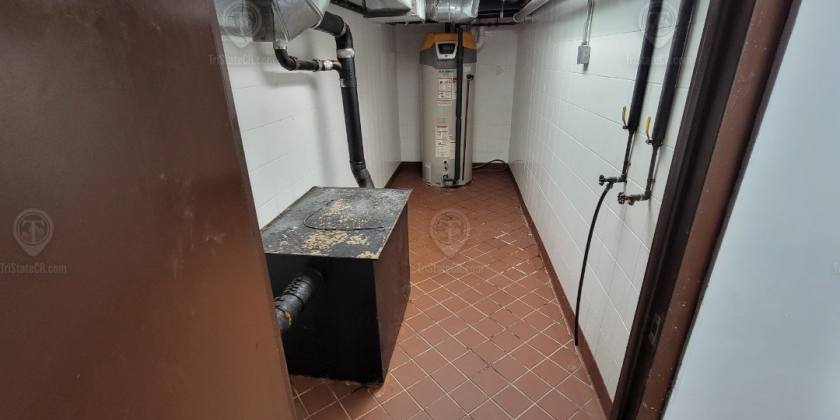
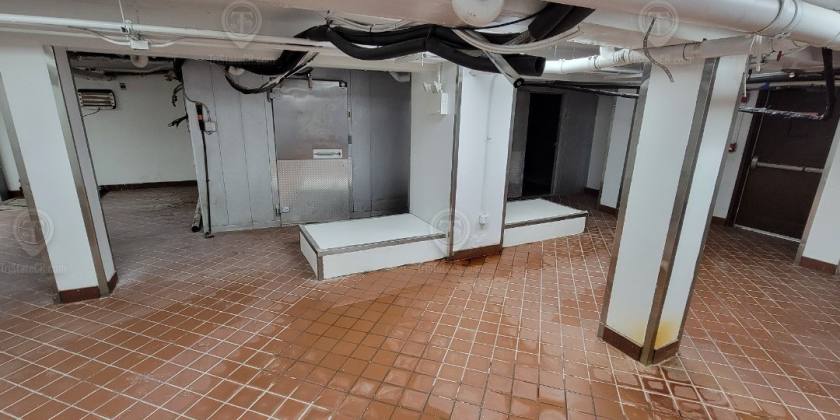
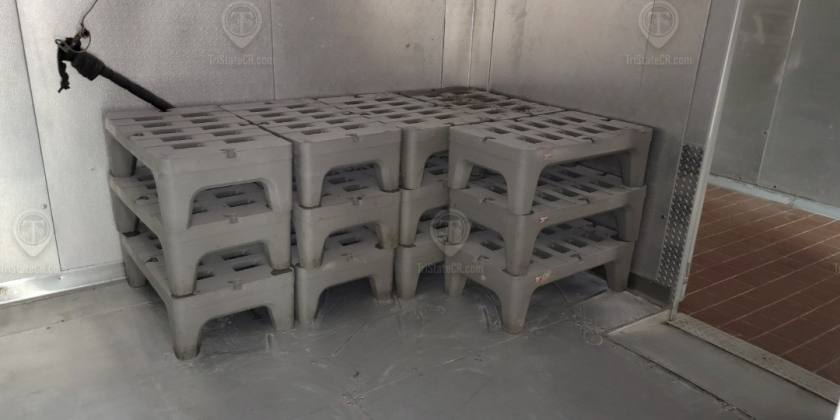
- • 2,000 SF basement with walk-ins & grease traps
- • 49.5' of frontage on Queens Blvd
- • Open floorplan
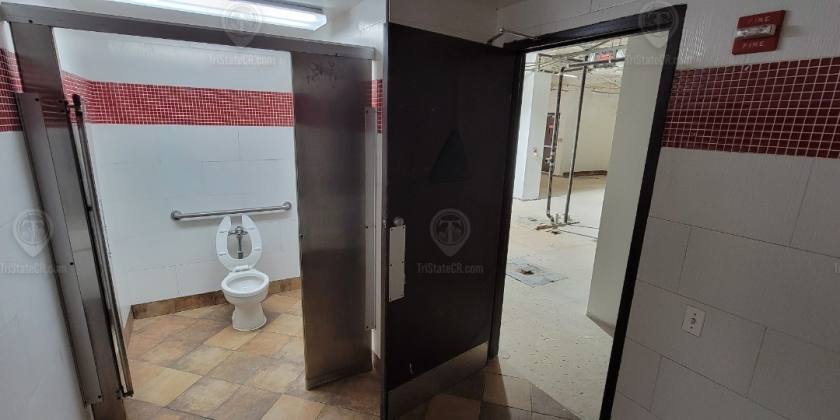
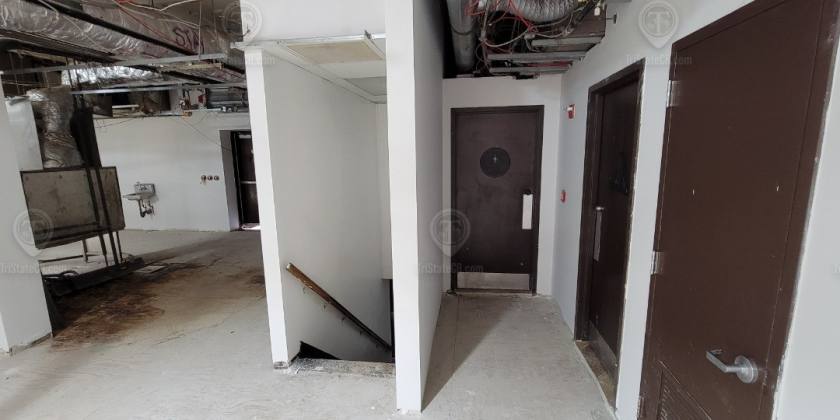
Additional Photos


Listing Agents

Shlomi Bagdadi
O: 718-437-6100
info@tristatecr.com
O: 718-437-6100
info@tristatecr.com
While we strive to provide the most accurate information, all listing information, and demographic data, is provided by third-parties. As such, MyEListing will not be responsible for the accuracy of the information. It is strongly recommended that you verify all information with the listing agent, and any relevant agencies, prior to making any decisions.