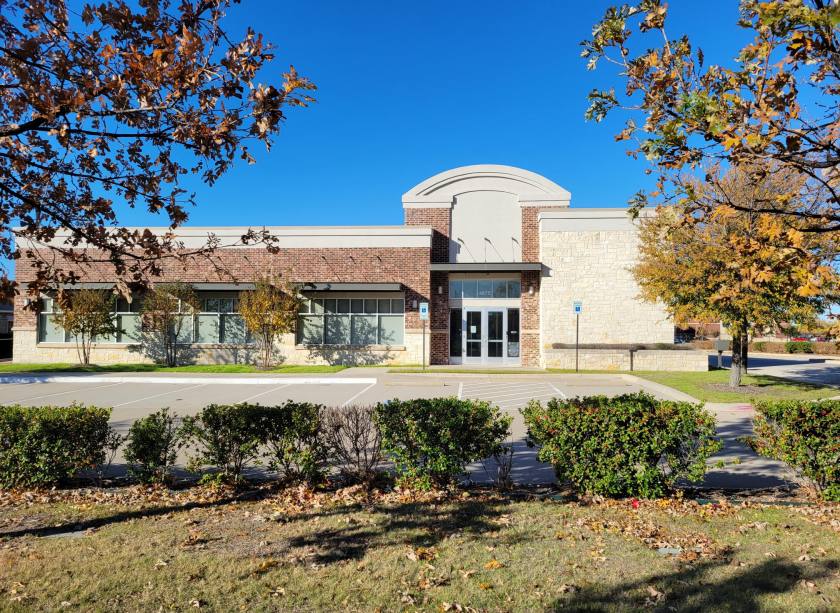
1-Mile | 3-Miles | 5-Miles | ||
---|---|---|---|---|
Total Population | 10,178 | 98,891 | 277,995 | |
Population Median Age | 36 | 36 | 35 | |
Population by Age | 0-9 Yrs | 1101 (10%) | 12809 (12%) | 36833 (13%) |
10-19 Yrs | 1495 (14%) | 14328 (14%) | 43666 (15%) | |
20-29 Yrs | 1453 (14%) | 12163 (12%) | 31218 (11%) | |
30-39 Yrs | 1744 (17%) | 16266 (16%) | 39991 (14%) | |
40-49 Yrs | 1659 (16%) | 17755 (17%) | 53403 (19%) | |
50-59 Yrs | 1434 (14%) | 12832 (12%) | 36616 (13%) | |
60-69 Yrs | 707 (6%) | 6992 (7%) | 21137 (7%) | |
70+ Yrs | 584 (5%) | 5745 (5%) | 15129 (5%) | |
Median HH Income | $93,485 | $104,090 | $114,971 | |
Total Household Income | < 24K | 422 (9%) | 3512 (9%) | 7343 (7%) |
25-49K | 671 (15%) | 5056 (13%) | 10957 (10%) | |
50-74K | 585 (13%) | 4985 (12%) | 12254 (12%) | |
75-99K | 624 (14%) | 4844 (12%) | 12300 (12%) | |
100-199K | 1504 (35%) | 13310 (34%) | 35808 (35%) | |
200K+ | 473 (11%) | 6769 (17%) | 21828 (21%) | |
Highest Education Level | No Diploma | 394 | 3134 | 7058 |
Diploma or GED | 763 | 6636 | 18033 | |
Some College | 1078 | 10793 | 27513 | |
Assoc. Degree | 500 | 4188 | 12028 | |
Bachelors Degree | 2671 | 24845 | 70728 | |
Higher Degree | 1513 | 16432 | 47705 | |
Total Housing Units | 4,744 | 41,480 | 107,041 | |
--Owner-Occupied | 1,807 | 19,890 | 60,737 | |
--Renter-Occupied | 2,472 | 18,586 | 39,752 | |
Owner-Occupied Values | < 100K | 19 | 384 | 703 |
100-199K | 39 | 766 | 2784 | |
200-299K | 489 | 4615 | 10979 | |
300-399K | 811 | 5854 | 17021 | |
400-499K | 196 | 3386 | 12227 | |
500K+ | 252 | 4885 | 17023 | |
Total Working Age Population | 8,188 | 76,660 | 212,310 | |
In Work Force | 6,011 | 55,283 | 153,307 | |
Not In Work Force | 2,177 | 21,376 | 59,002 | |
Workforce Employed | 5,722 | 52,866 | 147,174 | |
Workforce Unemployed | 275 | 2,302 | 5,980 | |
Civlian Workforce | 5,997 | 55,168 | 153,155 | |
Military Workforce | 14 | 115 | 152 | |
Total Households | 4,279 | 38,476 | 100,489 | |
Family Households | 2,457 | 24,870 | 72,416 | |
Non-Family Households | 1,821 | 13,606 | 28,073 | |
Married Couple | 2,006 | 20,423 | 61,769 | |
Other Family | 451 | 4,448 | 10,647 | |
Married w/Child | 1,108 | 12,262 | 36,566 | |
Single Male w/Child | 64 | 544 | 1,515 | |
Single Female w/Child | 153 | 1,957 | 4,751 |
Population Change Last Two Decades - Plus Projection
2000 | % | 2010 | % | 2020 | % | 2030 | |
---|---|---|---|---|---|---|---|
Texas | 20,851,820 | +21 | 25,145,561 | +18 | 29,677,668 | +18 | 34,894,452 |
Denton County | 432,976 | +53 | 662,614 | +36 | 897,953 | +37 | 1,234,110 |
Collin County | 491,675 | +59 | 782,341 | +33 | 1,039,369 | +34 | 1,391,461 |
Total Working Age Population:
Total Households:
Total Working Age Population:
Total Households:
Total Working Age Population:
Total Households: