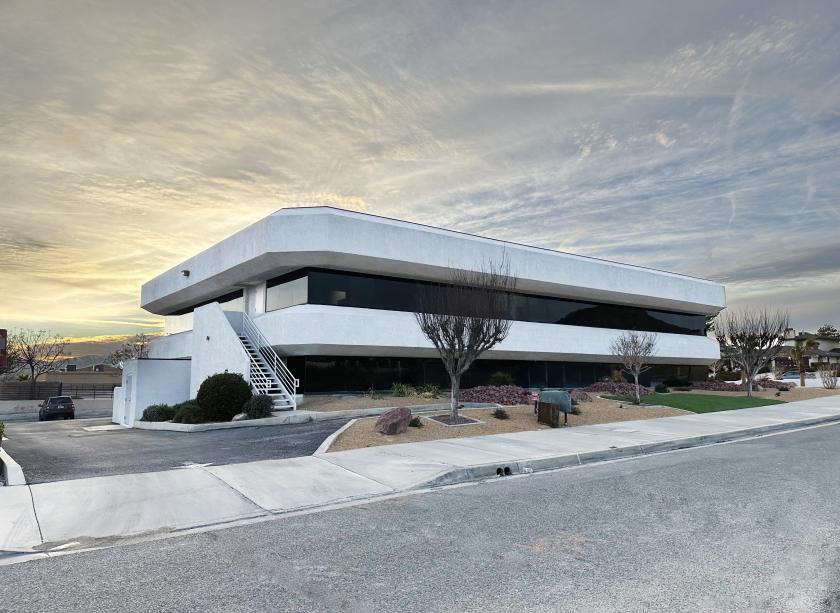
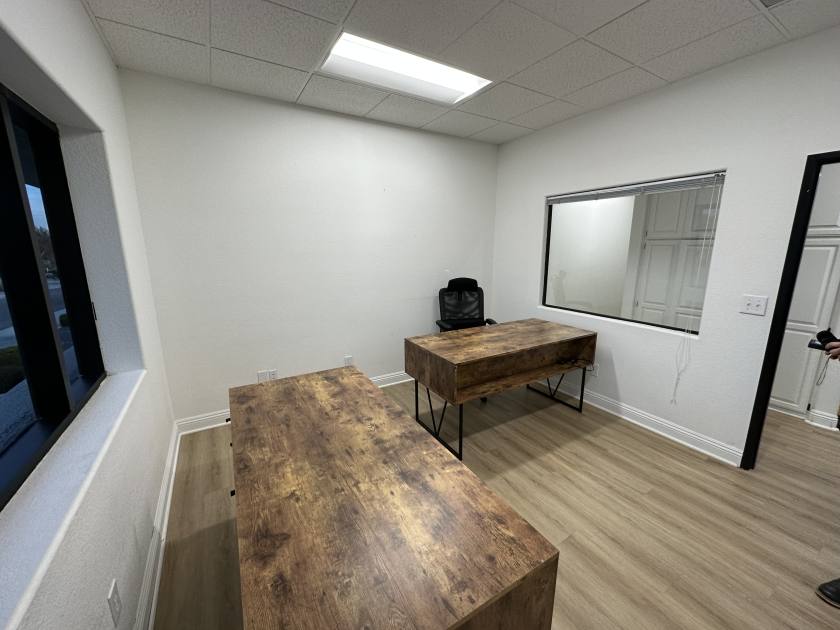
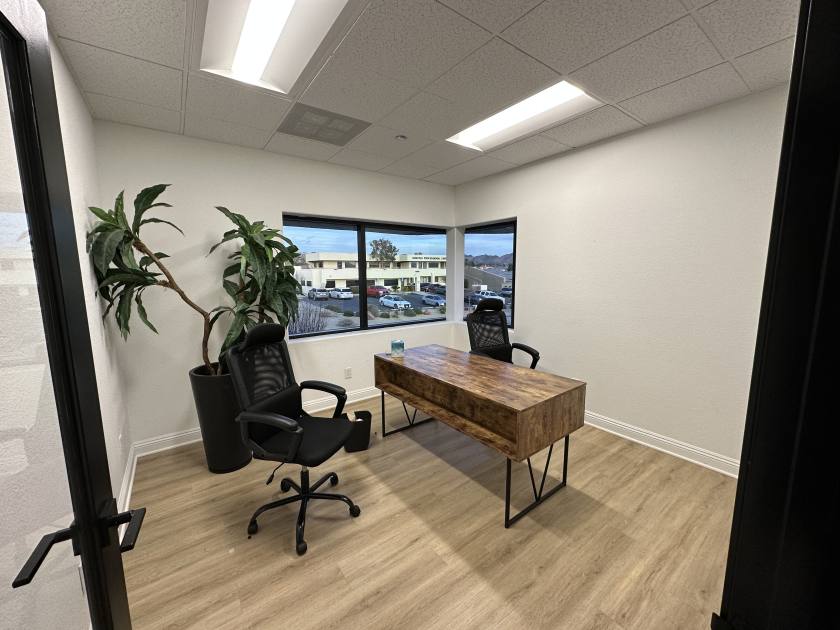
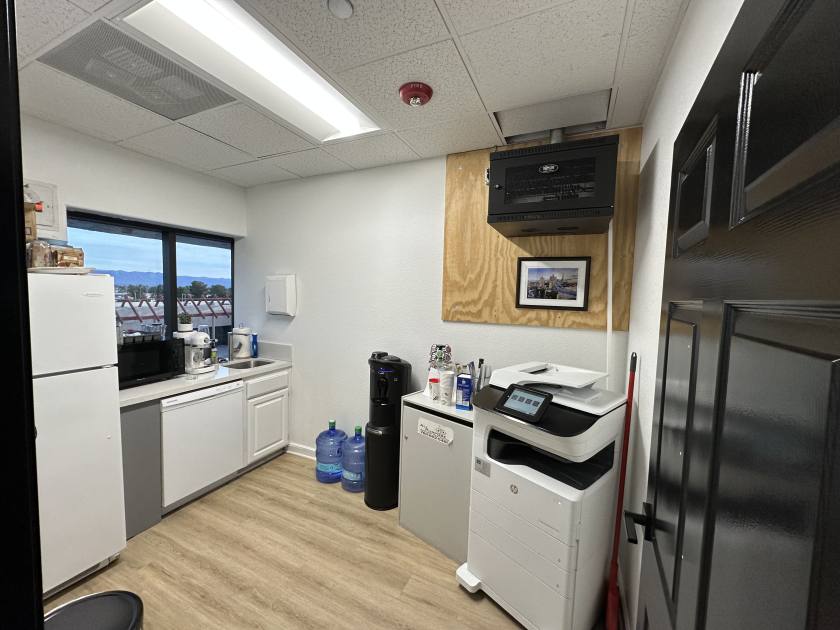
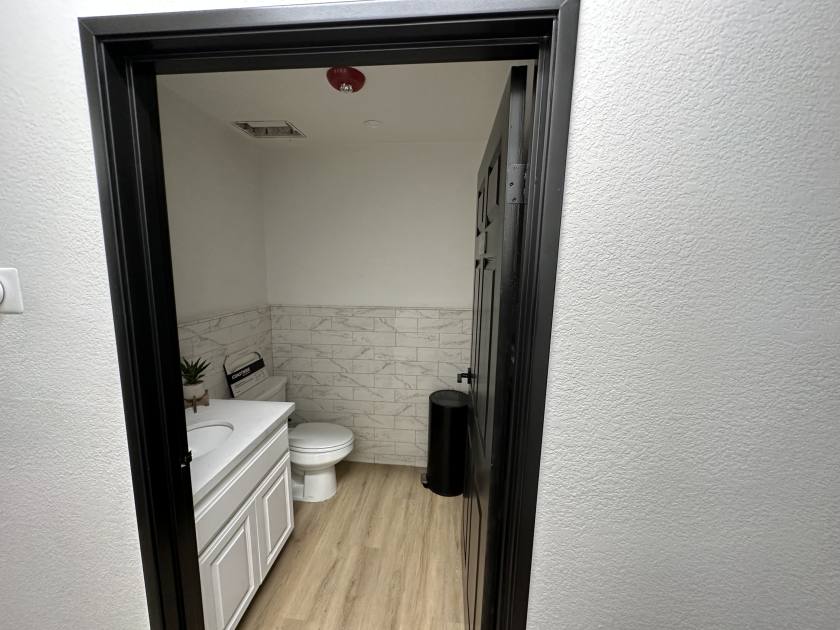
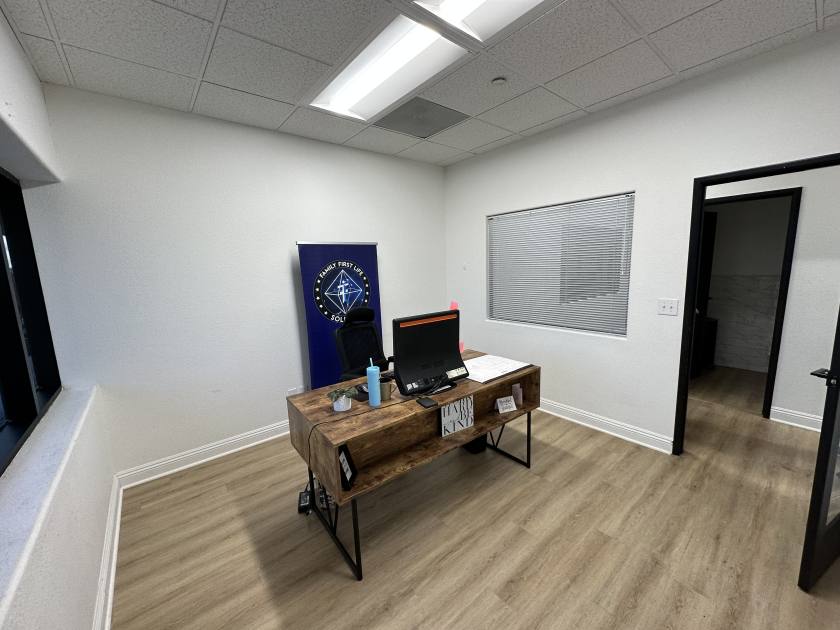
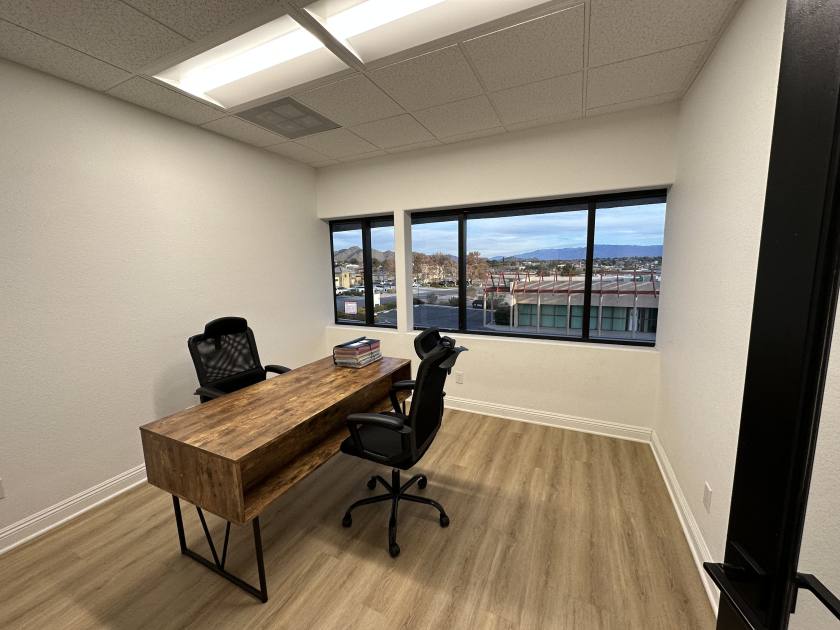
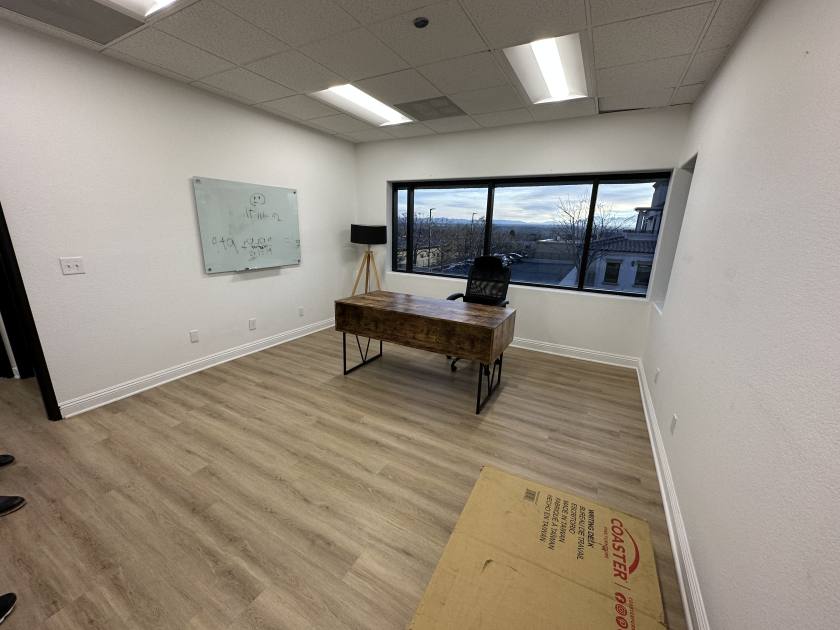
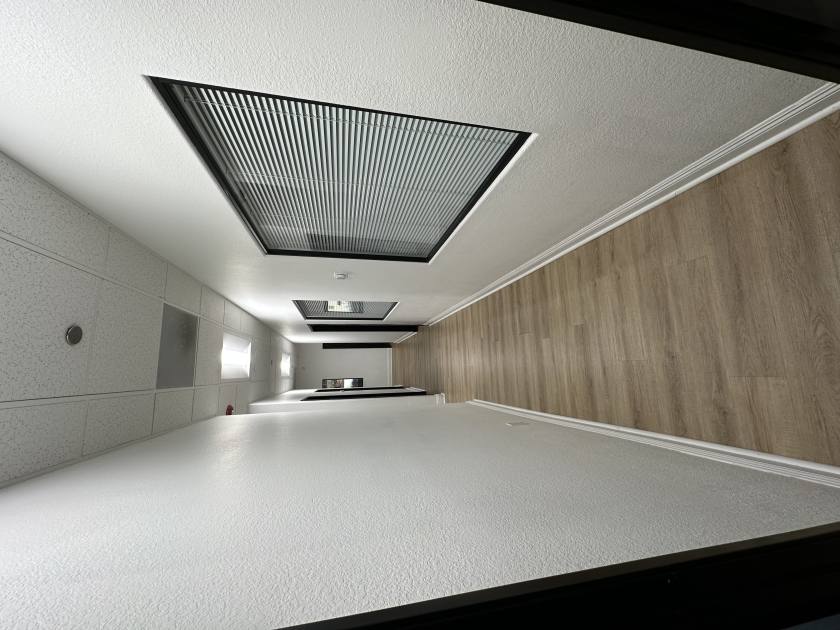
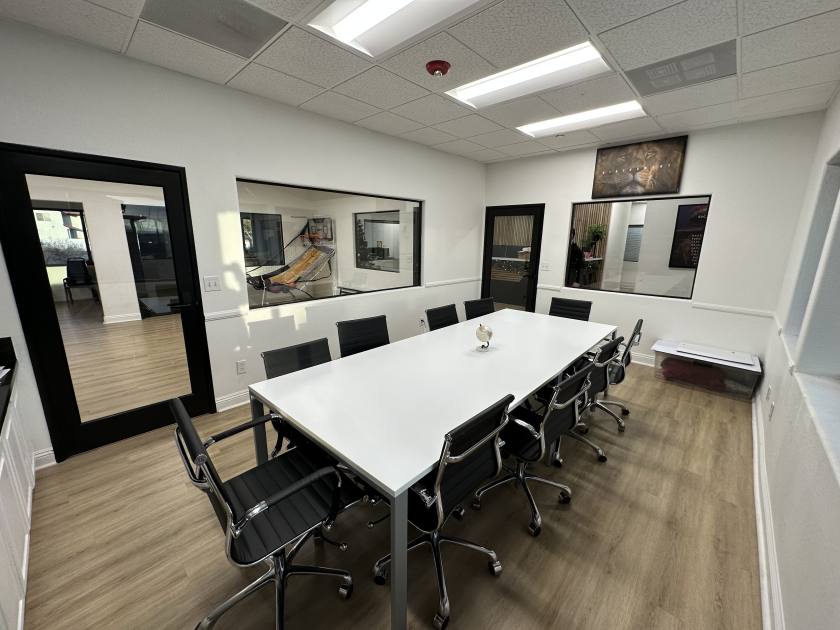
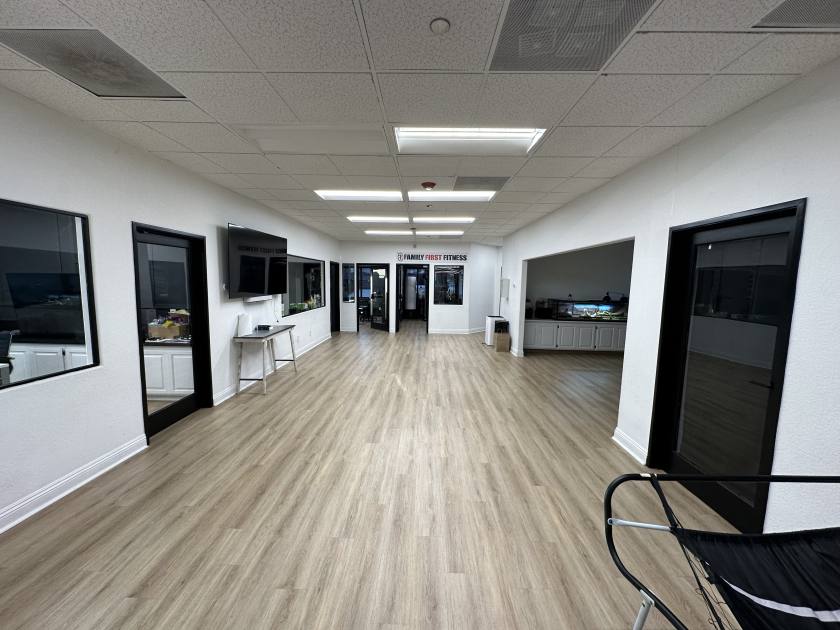
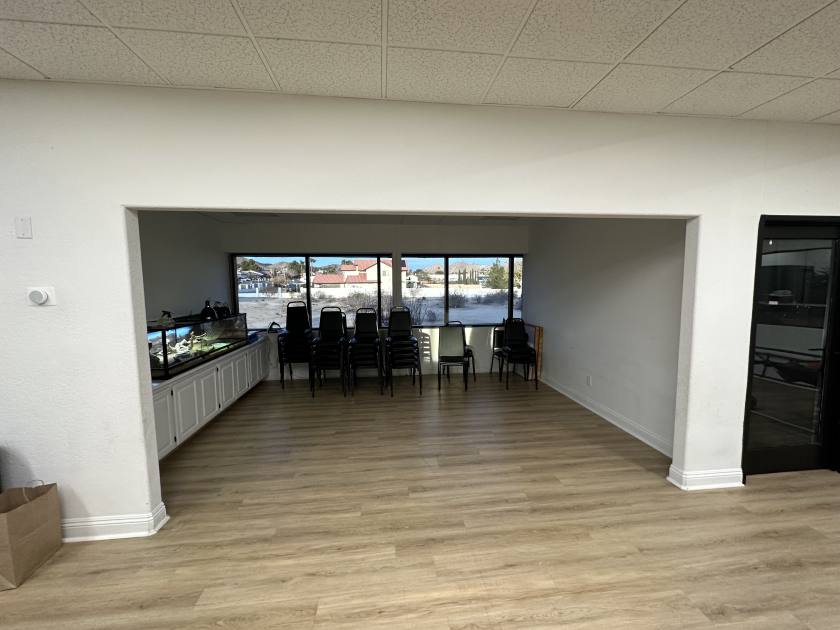
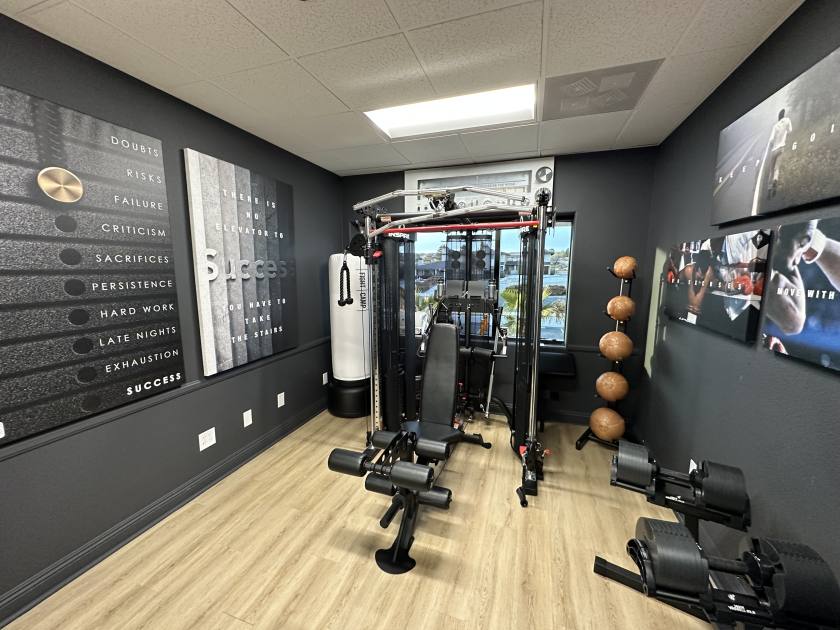
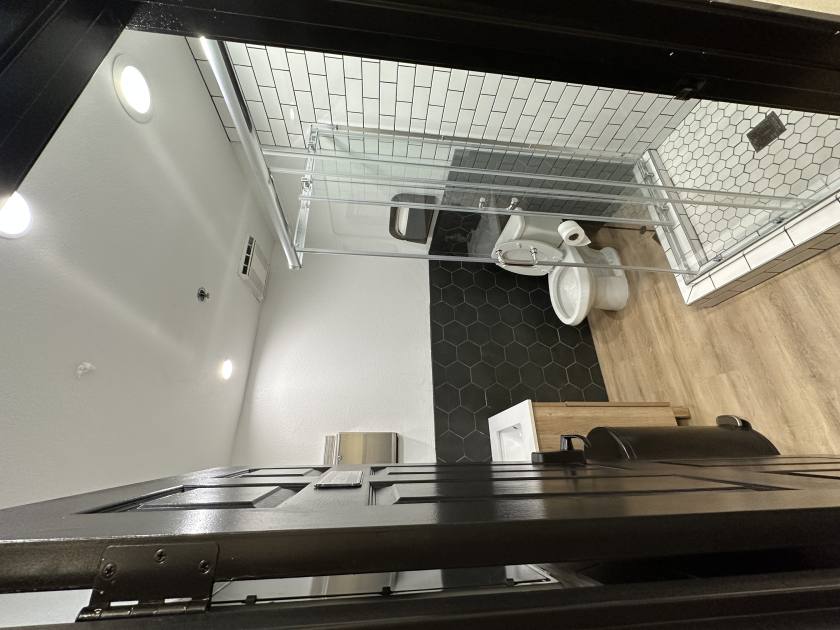
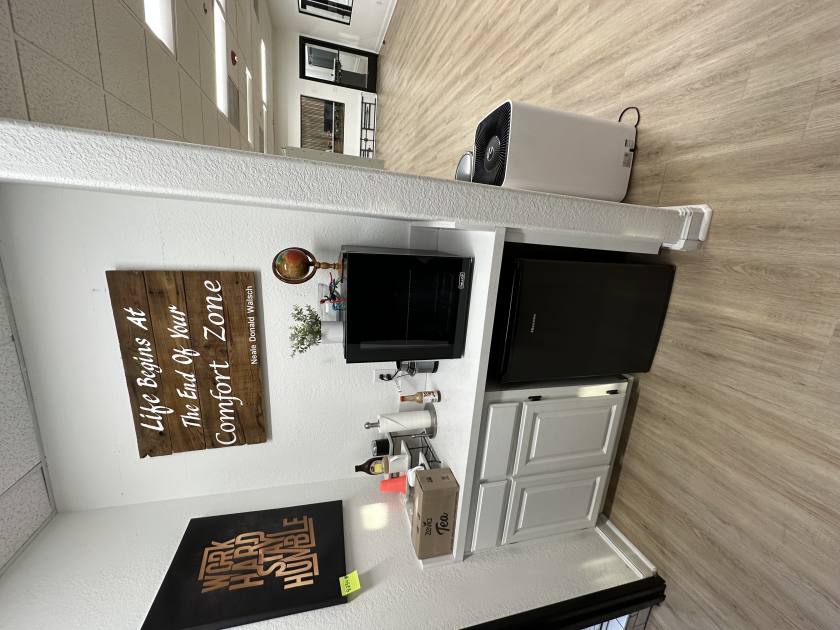
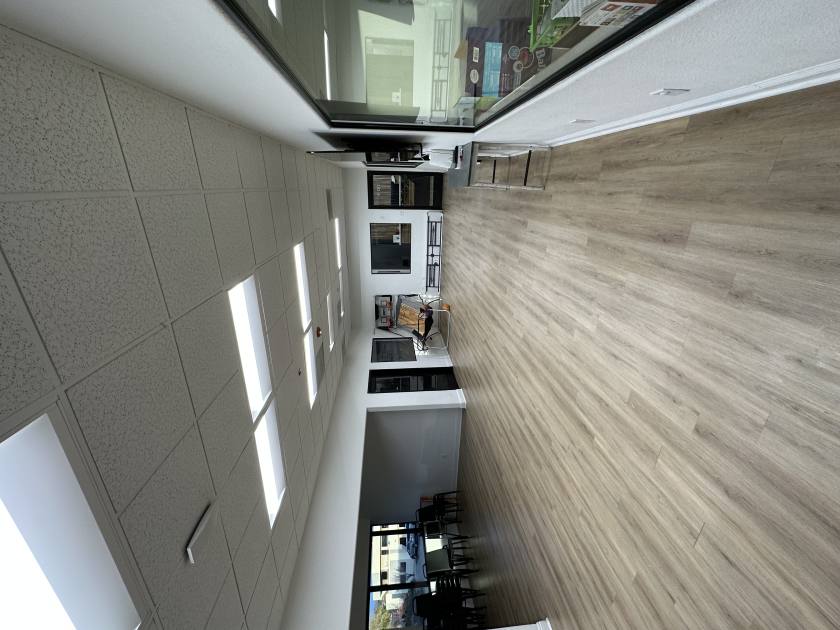
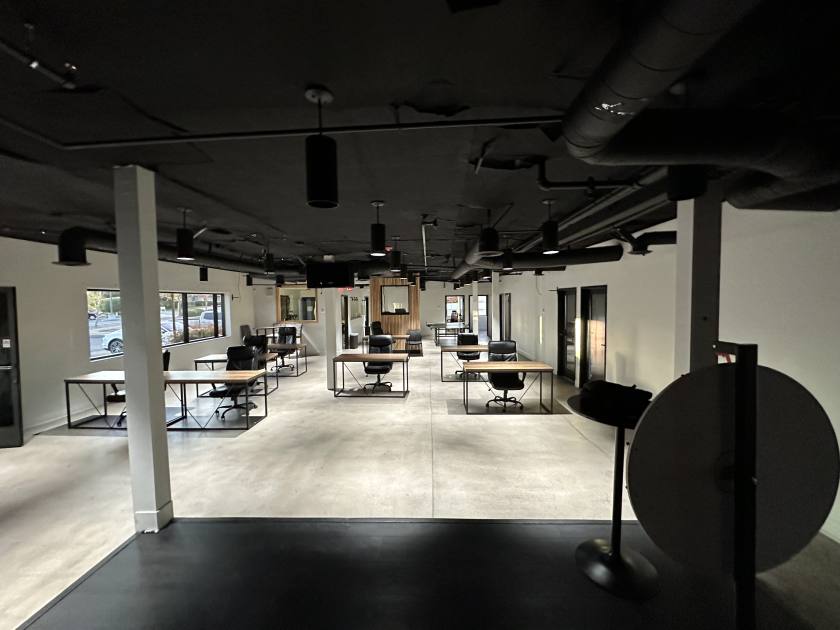
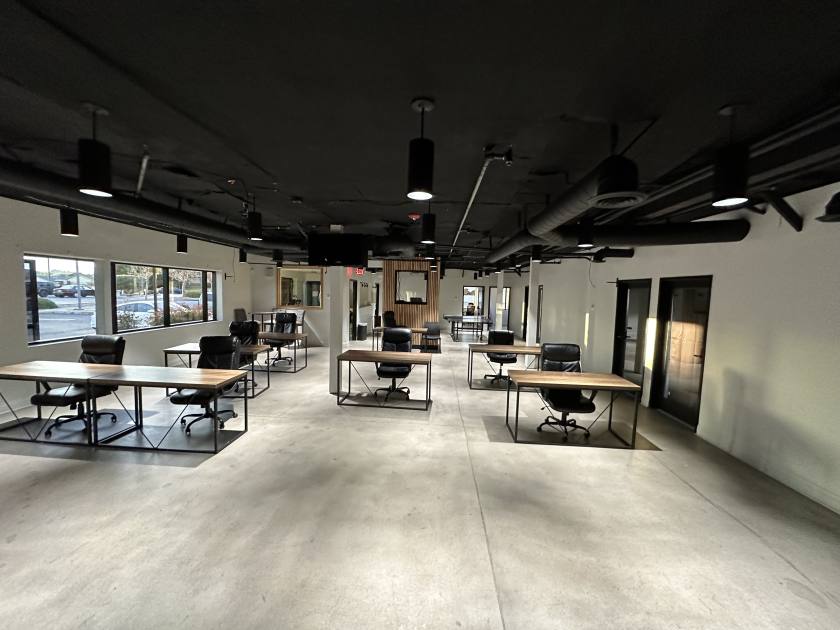
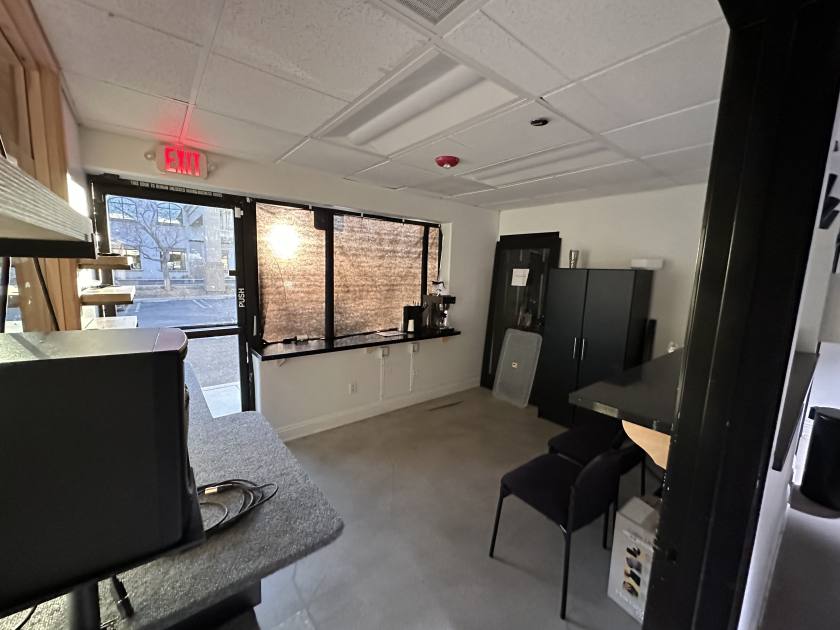
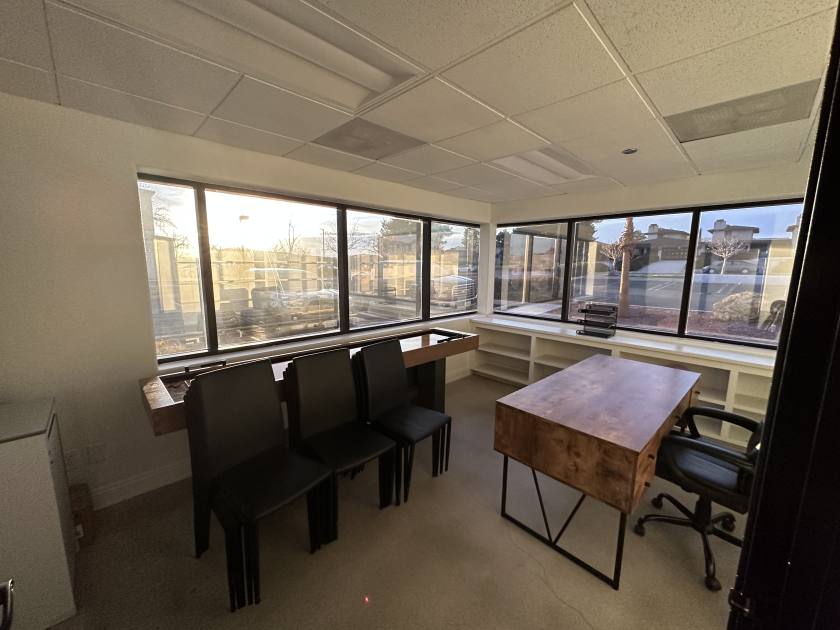
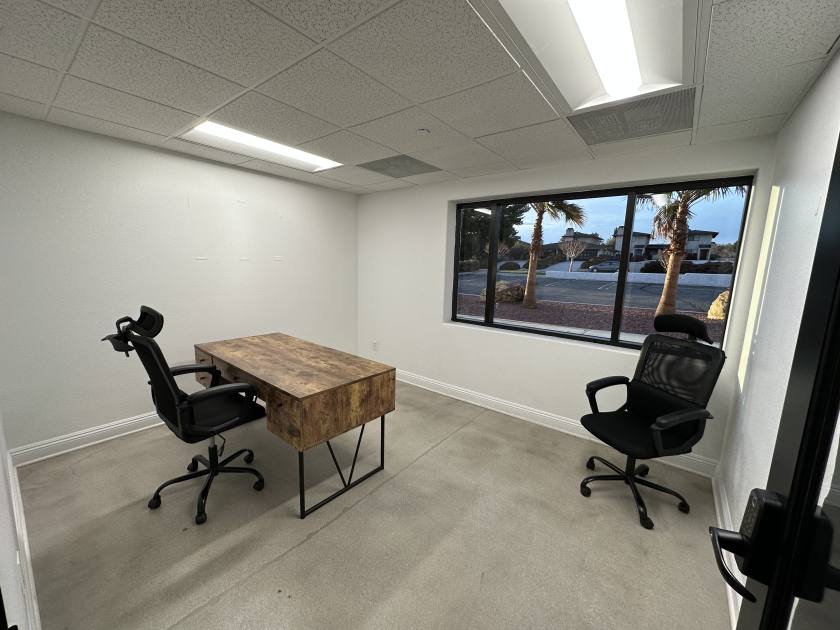
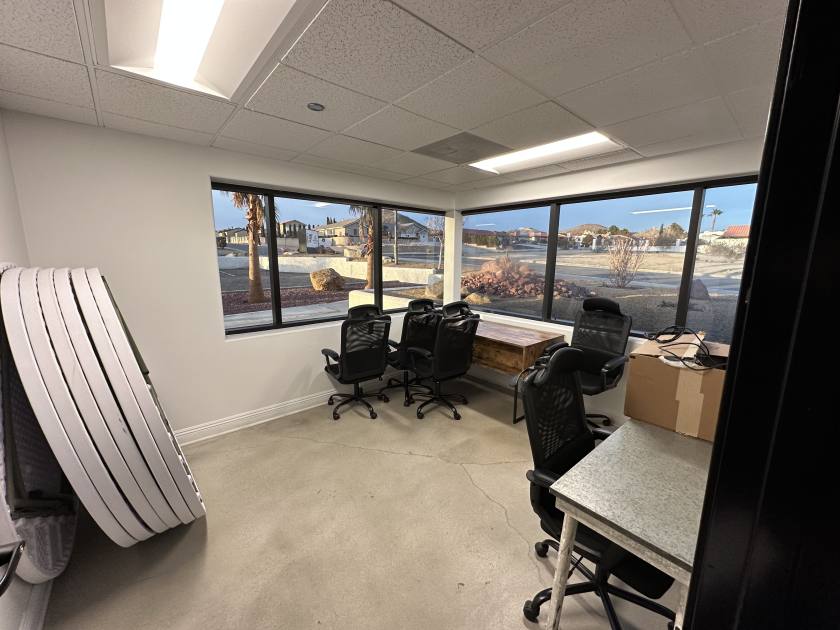
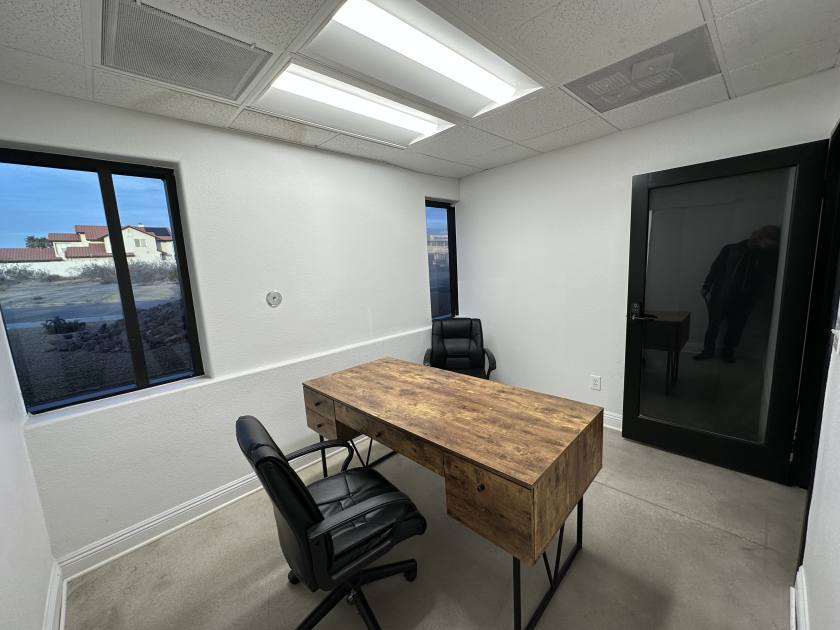
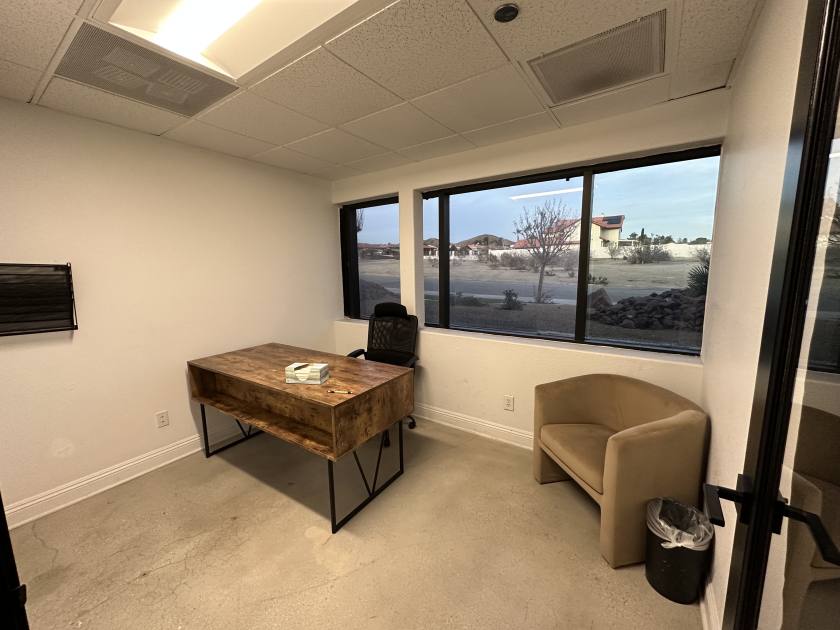
Executive Suites for Lease in a newly renovated two-story office building in Apple Valley, CA. Available for terms or month to month leases. These Modern suites are available in a prominent Office/Medical hub in the town, within walking distance to St. Mary's hospital and close to the I-15 freeway, eateries, medical, banking and other professional services. The building has been recently updated with new finishes throughout. Features include an event center, podcast room, gym and conference room. Multiple executive suites are available both upstairs and downstairs on a first-come, first-serve basis; each with very manageable sizes, amazing views, and secured keycard access. Any tenant will appreciate the Full Gross Lease structure which includes gas, water, trash, electric, and common area maintenance. ONE FEE PAYS ALL COSTS. Other INCLUDED amenities are cleaning services, if desired, receptionist during business hours, Wi-fi and individual alarm code for 24/7 access. Both upstairs and downstairs have shared restrooms, events center (fee applies, upon availability) a kitchenette and Copy and Print room for use. With plenty of parking, an inviting entryway, and a plethora of other business professionals all within a single building, this is a must see for any small office user or anyone looking for a professional setting for their growing business.