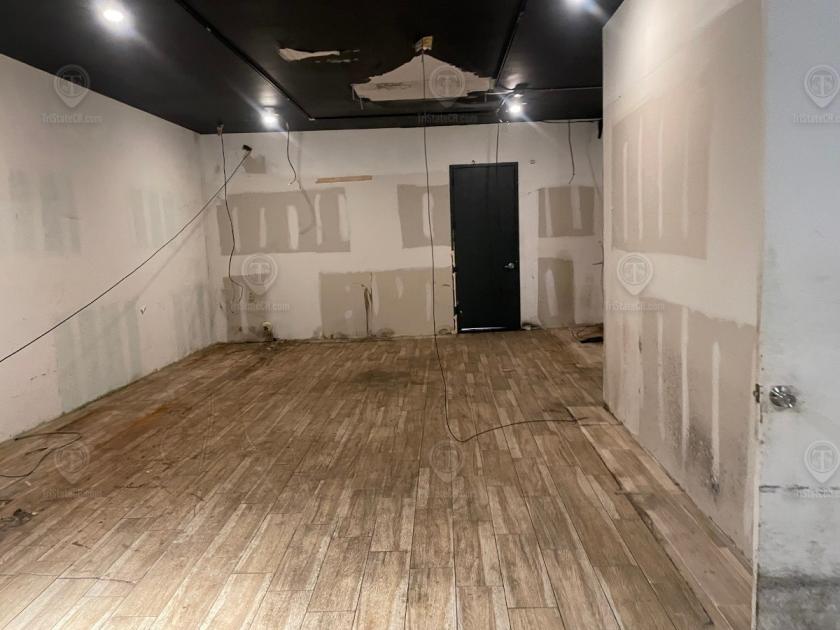
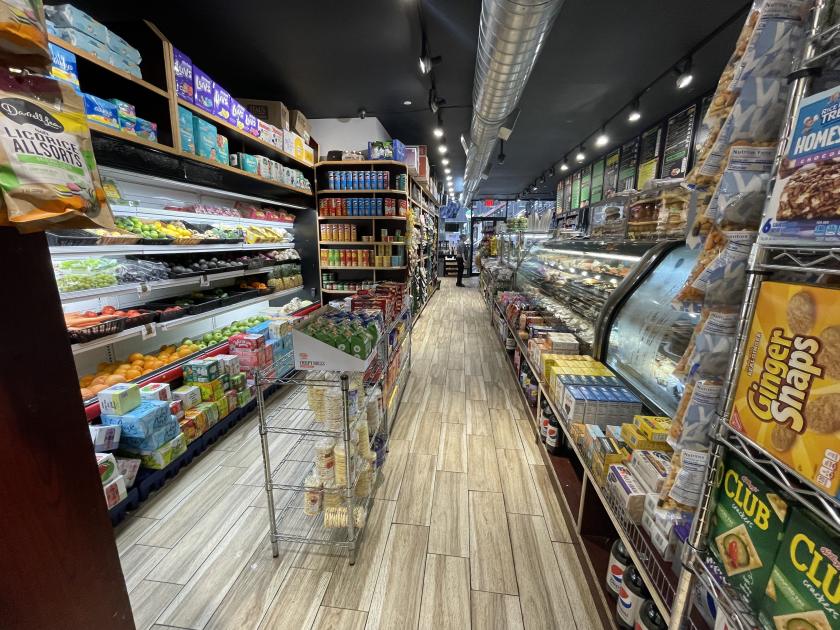
1-Mile | 3-Miles | 5-Miles | ||
---|---|---|---|---|
Total Population | 159,351 | 1,289,360 | 2,930,141 | |
Population Median Age | 31 | 37 | 38 | |
Population by Age | 0-9 Yrs | 29582 (18%) | 140117 (10%) | 312266 (10%) |
10-19 Yrs | 21050 (13%) | 116944 (9%) | 264603 (9%) | |
20-29 Yrs | 30092 (18%) | 260345 (20%) | 518668 (17%) | |
30-39 Yrs | 32267 (20%) | 264648 (20%) | 577910 (19%) | |
40-49 Yrs | 16342 (10%) | 161970 (12%) | 382638 (13%) | |
50-59 Yrs | 11453 (7%) | 131166 (10%) | 331286 (11%) | |
60-69 Yrs | 9453 (5%) | 105171 (8%) | 268958 (9%) | |
70+ Yrs | 9111 (5%) | 108998 (8%) | 273811 (9%) | |
Median HH Income | $69,237 | $86,863 | $84,686 | |
Total Household Income | < 24K | 14449 (24%) | 112047 (20%) | 241096 (19%) |
25-49K | 9829 (16%) | 76036 (13%) | 185528 (14%) | |
50-74K | 5986 (10%) | 61869 (11%) | 155636 (12%) | |
75-99K | 5286 (9%) | 56427 (10%) | 132861 (10%) | |
100-199K | 13696 (23%) | 137176 (24%) | 313731 (24%) | |
200K+ | 8637 (14%) | 109908 (19%) | 238632 (18%) | |
Highest Education Level | No Diploma | 19697 | 127294 | 267182 |
Diploma or GED | 20478 | 147978 | 405189 | |
Some College | 10459 | 96177 | 239638 | |
Assoc. Degree | 3689 | 40601 | 106567 | |
Bachelors Degree | 28717 | 305970 | 645691 | |
Higher Degree | 15214 | 221496 | 503544 | |
Total Housing Units | 62,201 | 618,401 | 1,441,679 | |
--Owner-Occupied | 8,661 | 128,963 | 335,364 | |
--Renter-Occupied | 49,221 | 424,499 | 932,119 | |
Owner-Occupied Values | < 100K | 199 | 4194 | 10683 |
100-199K | 156 | 2236 | 7278 | |
200-299K | 288 | 3650 | 11077 | |
300-399K | 301 | 4604 | 20060 | |
400-499K | 328 | 6027 | 24579 | |
500K+ | 7389 | 108252 | 261687 | |
Total Working Age Population | 116,213 | 1,080,965 | 2,456,851 | |
In Work Force | 79,425 | 745,840 | 1,683,038 | |
Not In Work Force | 36,788 | 335,125 | 773,813 | |
Workforce Employed | 74,482 | 703,750 | 1,588,542 | |
Workforce Unemployed | 4,916 | 41,827 | 93,845 | |
Civlian Workforce | 79,398 | 745,577 | 1,682,387 | |
Military Workforce | 27 | 263 | 651 | |
Total Households | 57,882 | 553,463 | 1,267,483 | |
Family Households | 32,360 | 259,517 | 625,614 | |
Non-Family Households | 25,522 | 293,946 | 641,869 | |
Married Couple | 21,803 | 169,733 | 412,172 | |
Other Family | 10,557 | 89,784 | 213,442 | |
Married w/Child | 11,168 | 68,860 | 166,925 | |
Single Male w/Child | 896 | 6,724 | 15,801 | |
Single Female w/Child | 3,303 | 28,652 | 67,500 |
Population Change Last Two Decades - Plus Projection
2000 | % | 2010 | % | 2020 | % | 2030 | |
---|---|---|---|---|---|---|---|
New Jersey | 8,414,350 | +4 | 8,791,894 | +4 | 9,132,700 | +4 | 9,530,900 |
Hudson County | 608,975 | +4 | 634,266 | +12 | 708,100 | +6 | 747,400 |
New York | 18,976,457 | +2 | 19,378,102 | +4 | 20,146,131 | +2 | 20,604,030 |
Queens County | 2,229,379 | 0 | 2,230,722 | +9 | 2,436,549 | +5 | 2,565,268 |
Kings County | 2,465,326 | +2 | 2,504,700 | +9 | 2,738,283 | +5 | 2,863,996 |
New York County | 1,537,195 | +3 | 1,585,873 | +6 | 1,688,894 | +2 | 1,727,631 |
Total Working Age Population:
Total Households:
Total Working Age Population:
Total Households:
Total Working Age Population:
Total Households: