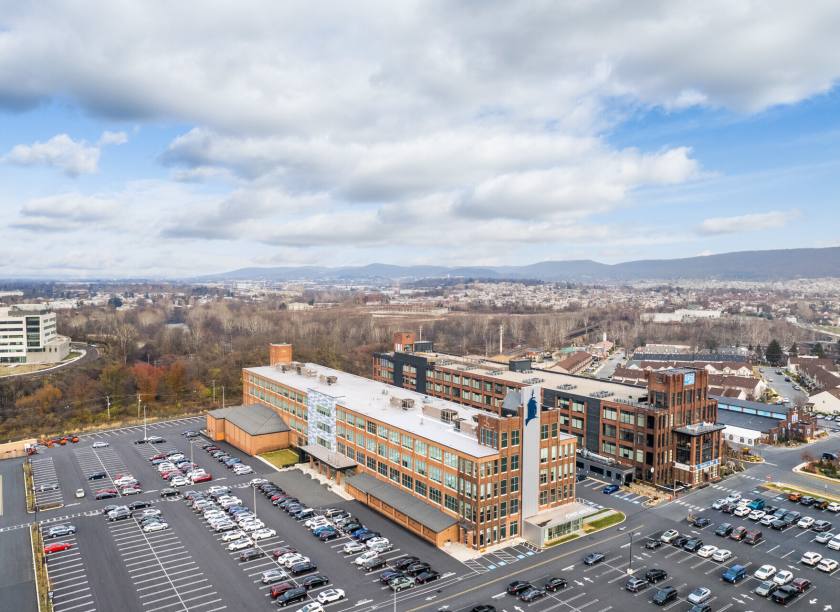
Office Space
739 Reading Avenue Reading, PA 19611
739 Reading Avenue Reading, PA 19611
Details & Description
Property Highlights
• A 100% new HVAC system consisting of eight (8) 20,000 CFM Roof Top Units with electric heat.
• The exterior Core and Shell renovations include new, energy efficient Solarban 60 windows
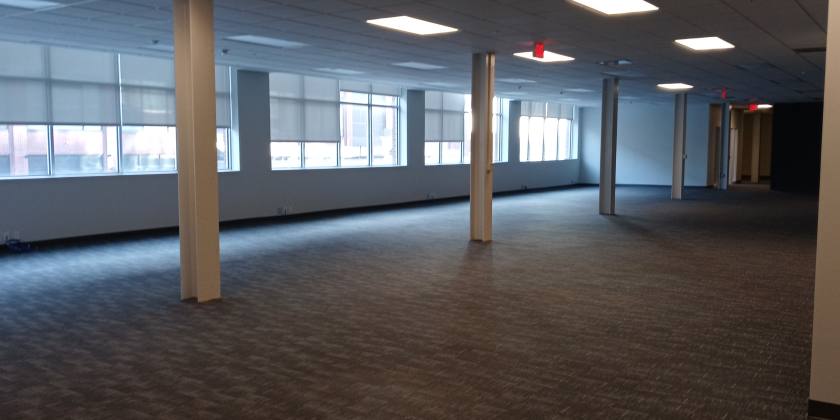
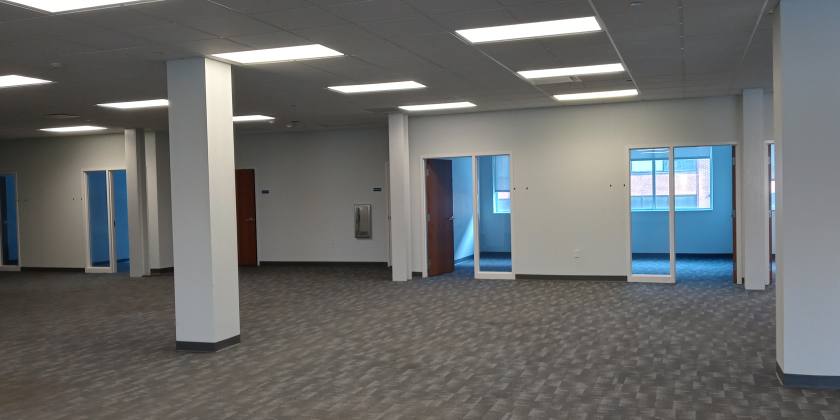
Additional Photos


Listing Agents

Robert Cook
O: 484-370-2655
M: 267-847-7609
bcook@jacksoncross.com
O: 484-370-2655
M: 267-847-7609
bcook@jacksoncross.com

Mike Barnes
O: 484-370-2655
M: 267-847-7609
mbarnes@jacksoncross.com
O: 484-370-2655
M: 267-847-7609
mbarnes@jacksoncross.com
While we strive to provide the most accurate information, all listing information, and demographic data, is provided by third-parties. As such, MyEListing will not be responsible for the accuracy of the information. It is strongly recommended that you verify all information with the listing agent, and any relevant agencies, prior to making any decisions.


