Commercial Land
NWQ Grand PkwySH-99 Morton Ranch Rd Katy, TX 77449
NWQ Grand PkwySH-99 Morton Ranch Rd Katy, TX 77449
Details & Description
Property Highlights
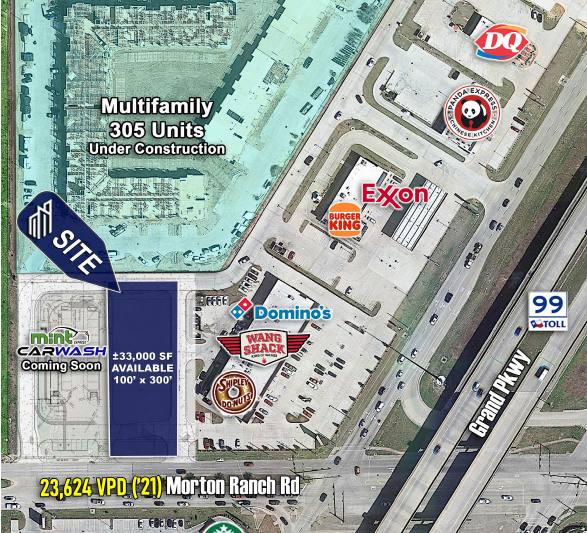
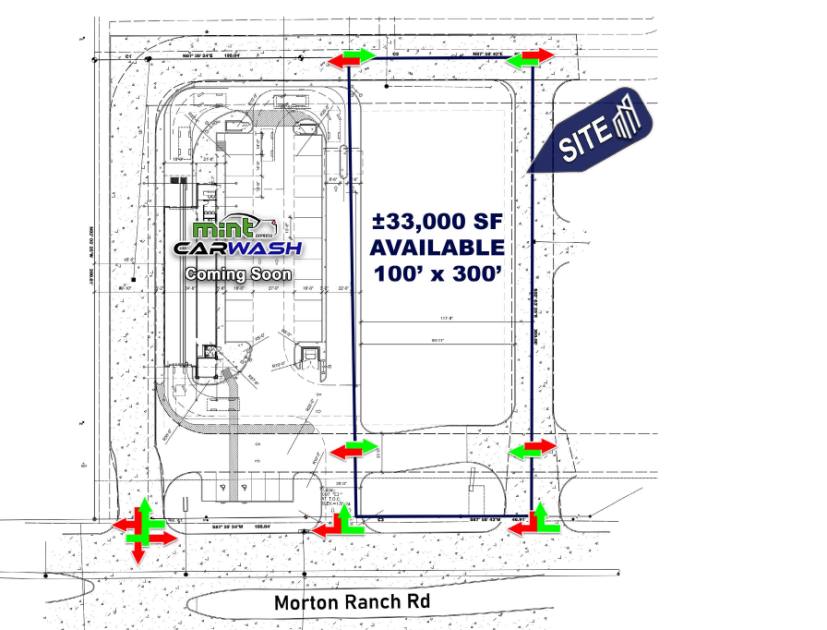
• Direct access to site from Grand Parkway with curb cuts on both Peek Rd and Morton Ranch Rd
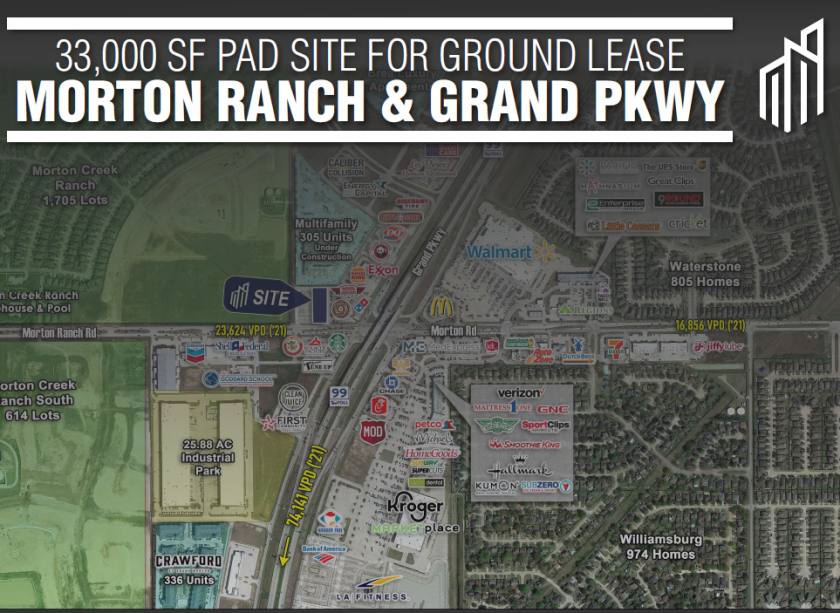
• Intersection of Grand Parkway and Morton Ranch Rd is one of the busiest in the area
Listing Agents

Mariam Haneef
O: 205-823-3030
mariam@theretailcompany.com
O: 205-823-3030
mariam@theretailcompany.com
While we strive to provide the most accurate information, all listing information, and demographic data, is provided by third-parties. As such, MyEListing will not be responsible for the accuracy of the information. It is strongly recommended that you verify all information with the listing agent, and any relevant agencies, prior to making any decisions.