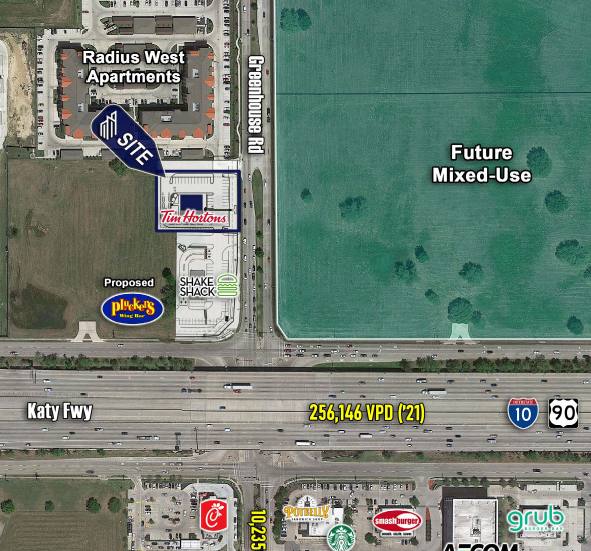
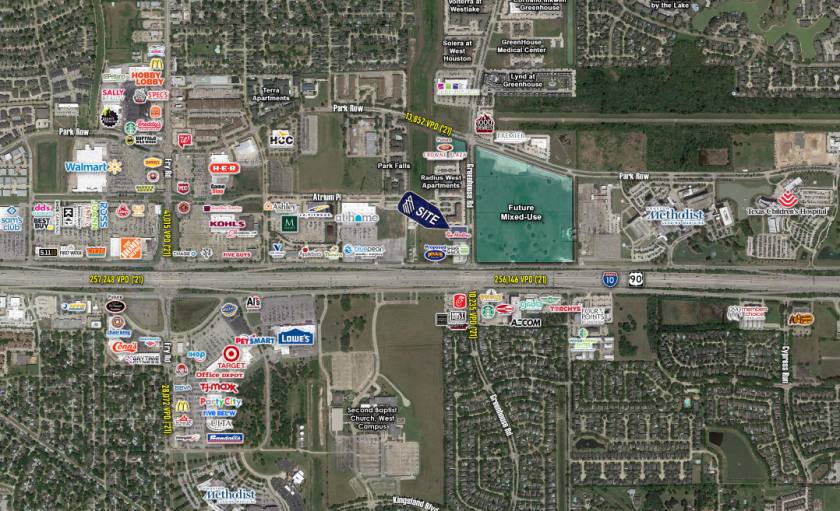
Retail Space
NWQ of I 10 Greenhouse Rd Houston, TX 77084
NWQ of I 10 Greenhouse Rd Houston, TX 77084
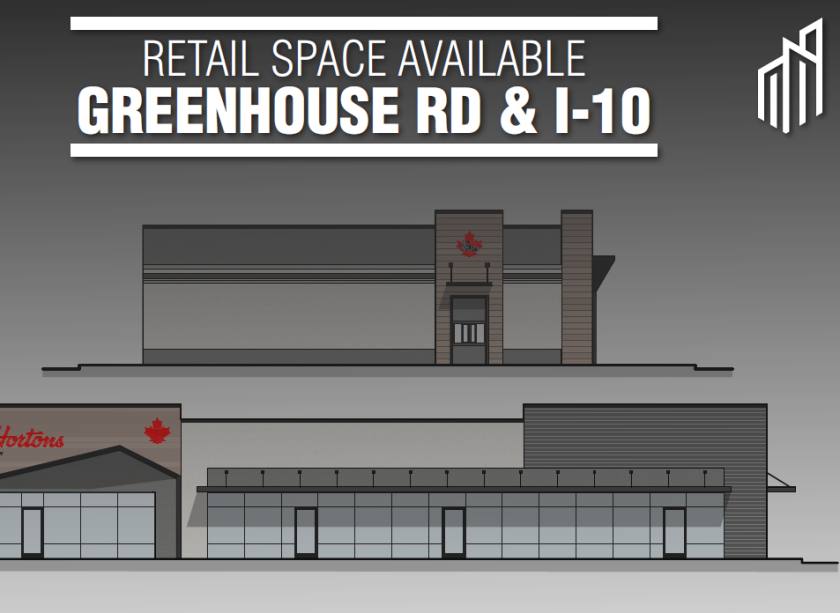
Details & Description
Property Highlights
- • Great visibility and access to Greenhouse and I-10
- • Divisible space
- • End cap available
Additional Photos

Listing Agents

Mariam Haneef
O: 205-823-3030
mariam@theretailcompany.com
O: 205-823-3030
mariam@theretailcompany.com
While we strive to provide the most accurate information, all listing information, and demographic data, is provided by third-parties. As such, MyEListing will not be responsible for the accuracy of the information. It is strongly recommended that you verify all information with the listing agent, and any relevant agencies, prior to making any decisions.


