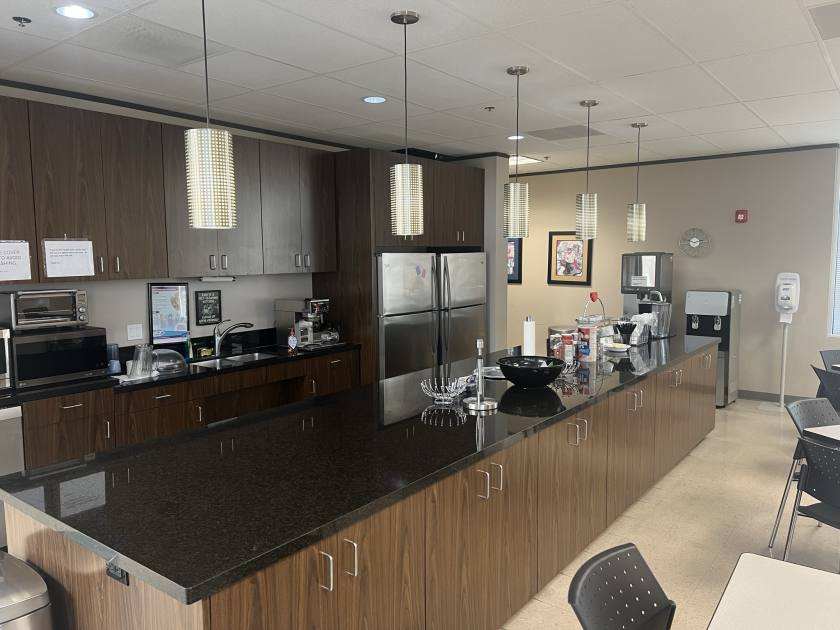
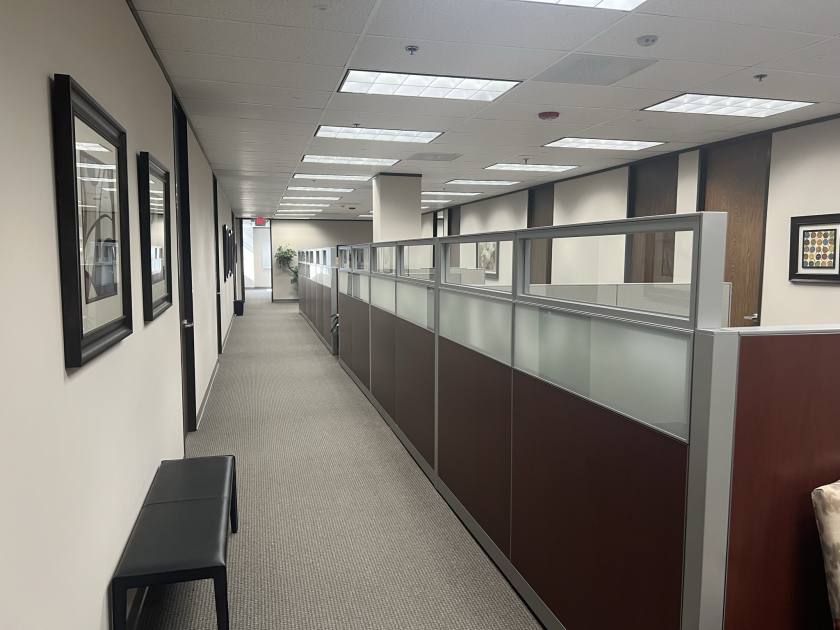
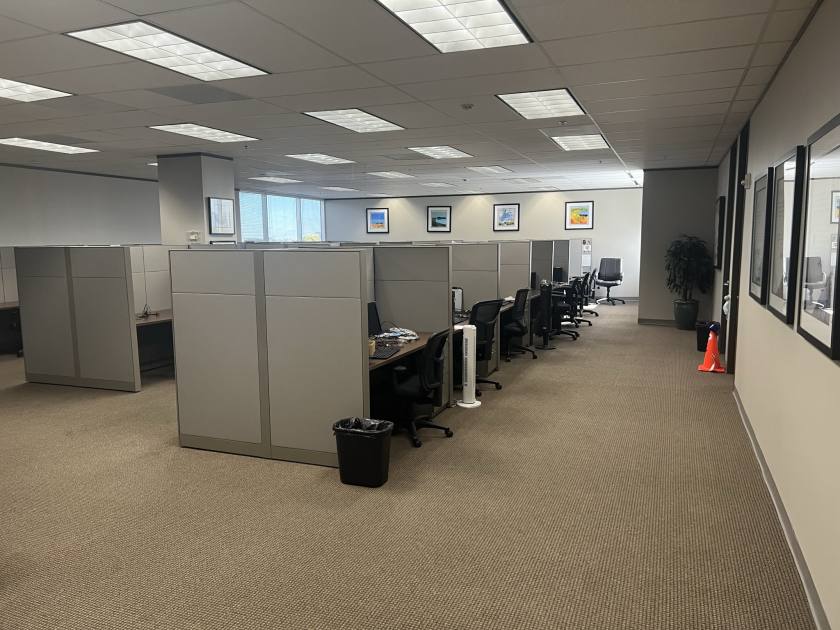
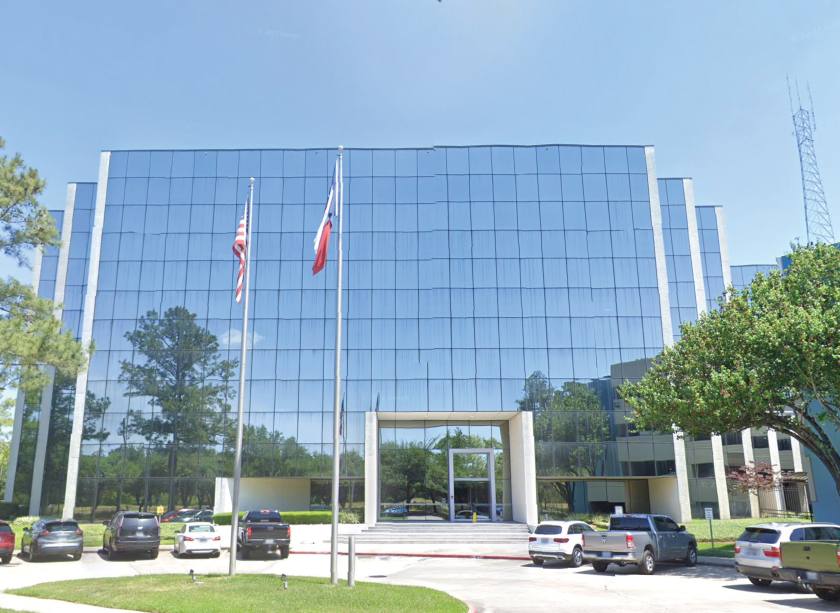
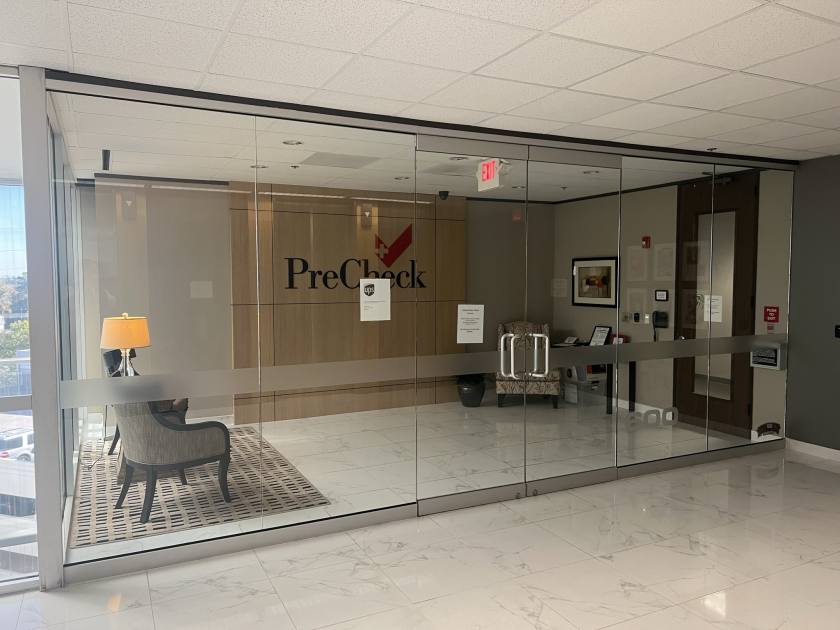
Office Space
2500 East T C Jester Boulevard Houston, TX 77008
2500 East T C Jester Boulevard Houston, TX 77008
Details & Description
Property Highlights
- • Sublease term through October 31, 2024
- • Available: Immediately
- • Rental Rate: Negotiable
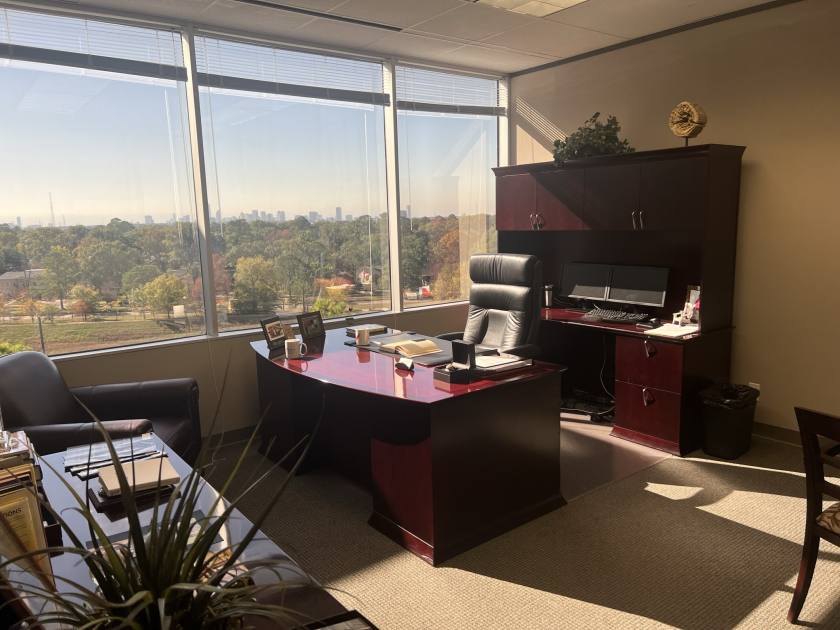
- • Furniture: Included
- • On-site deli & ATM
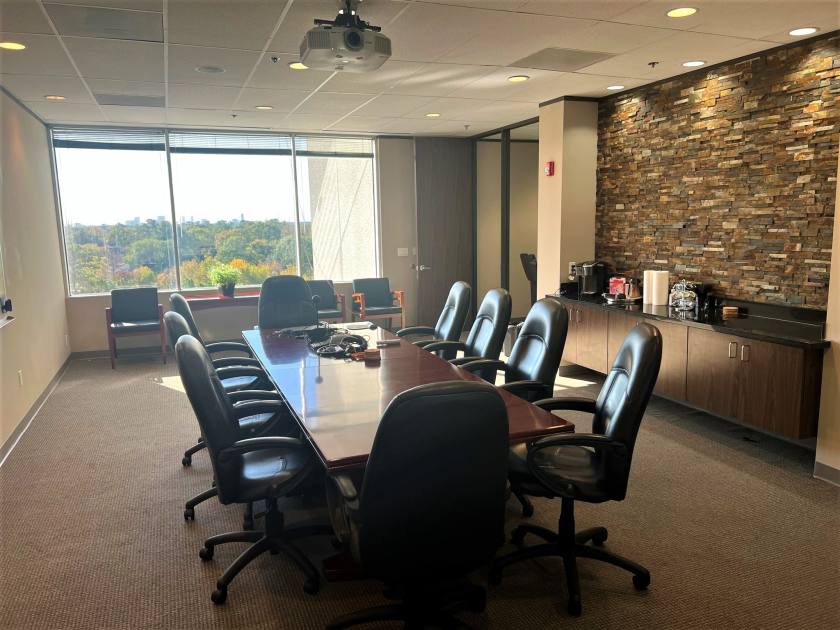
- • Conference room with WiFi
Additional Photos

Listing Agents

Roy Sweeney
O: 713-882-6905
M: 713-882-6905
roy.sweeney@colliers.com
O: 713-882-6905
M: 713-882-6905
roy.sweeney@colliers.com
While we strive to provide the most accurate information, all listing information, and demographic data, is provided by third-parties. As such, MyEListing will not be responsible for the accuracy of the information. It is strongly recommended that you verify all information with the listing agent, and any relevant agencies, prior to making any decisions.