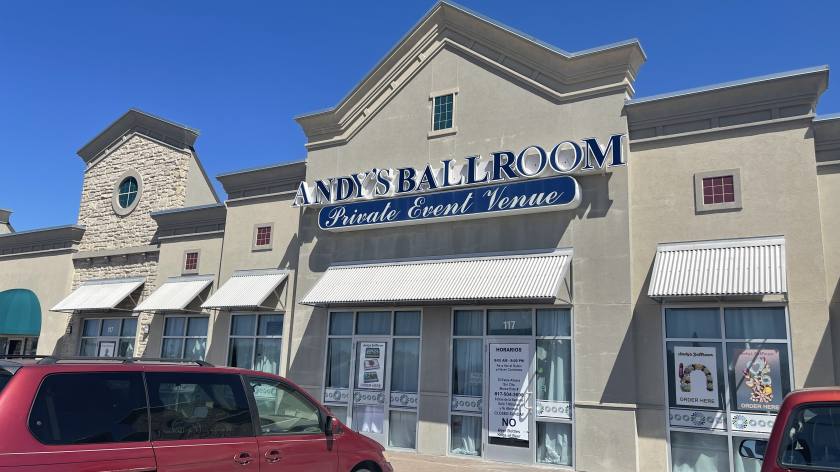
Retail Space
5601 Basswood Boulevard Fort Worth, TX 76137
5601 Basswood Boulevard Fort Worth, TX 76137

Details & Description
Property Highlights
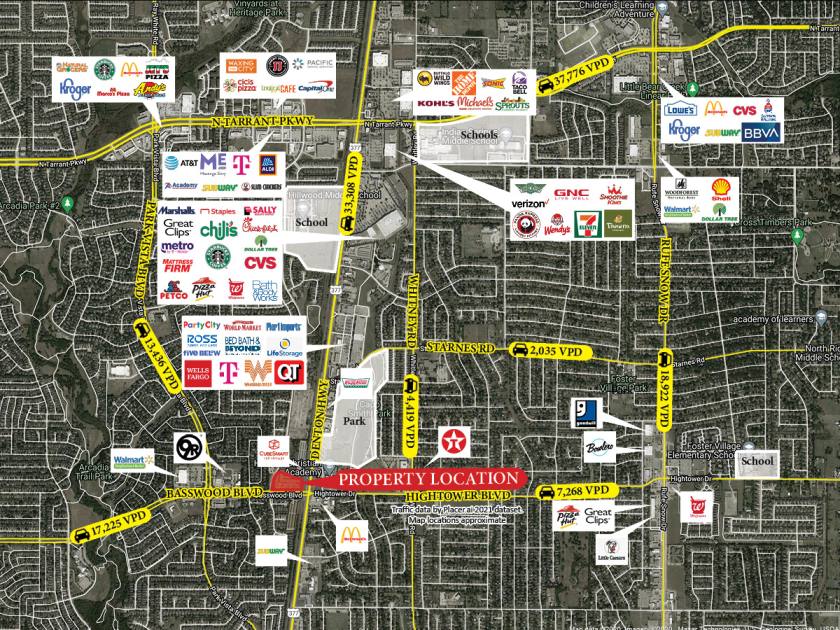
- • True Trade Area Population: 564,765
- • 36,035 SF Center
- • Tarrant County, Texas
- • LED Parking Lot Lights
- • Great Visibility & Access
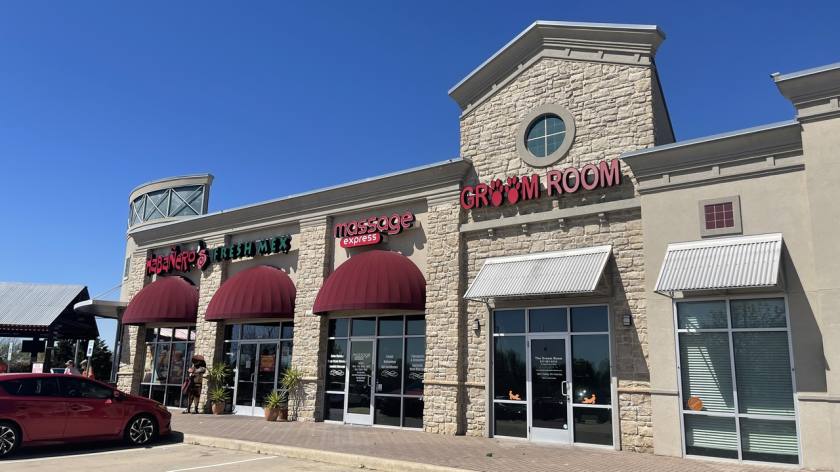
Additional Photos


Listing Agents

Stone Beyer
O: 817-927-0050
beyer@woodcrestcapital.com
O: 817-927-0050
beyer@woodcrestcapital.com
While we strive to provide the most accurate information, all listing information, and demographic data, is provided by third-parties. As such, MyEListing will not be responsible for the accuracy of the information. It is strongly recommended that you verify all information with the listing agent, and any relevant agencies, prior to making any decisions.