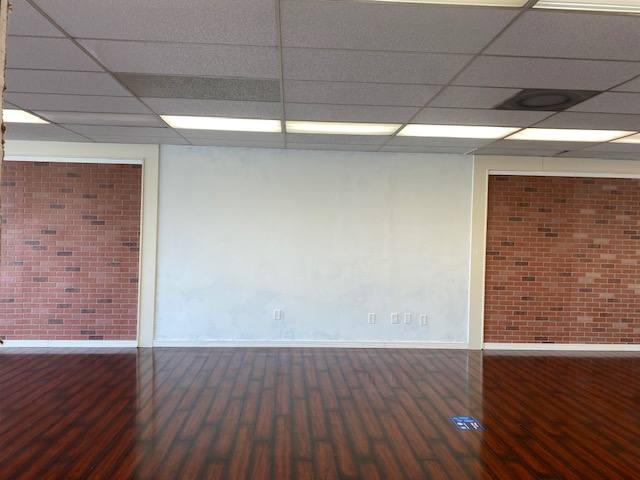
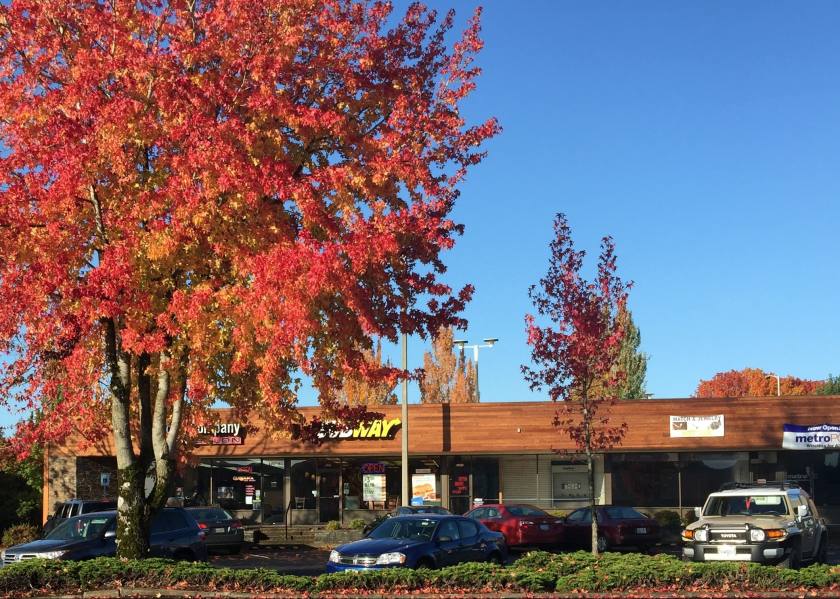
Retail Space
8207 Northeast Vancouver Mall Drive Vancouver, WA 98662
8207 Northeast Vancouver Mall Drive Vancouver, WA 98662
Details & Description
Property Highlights
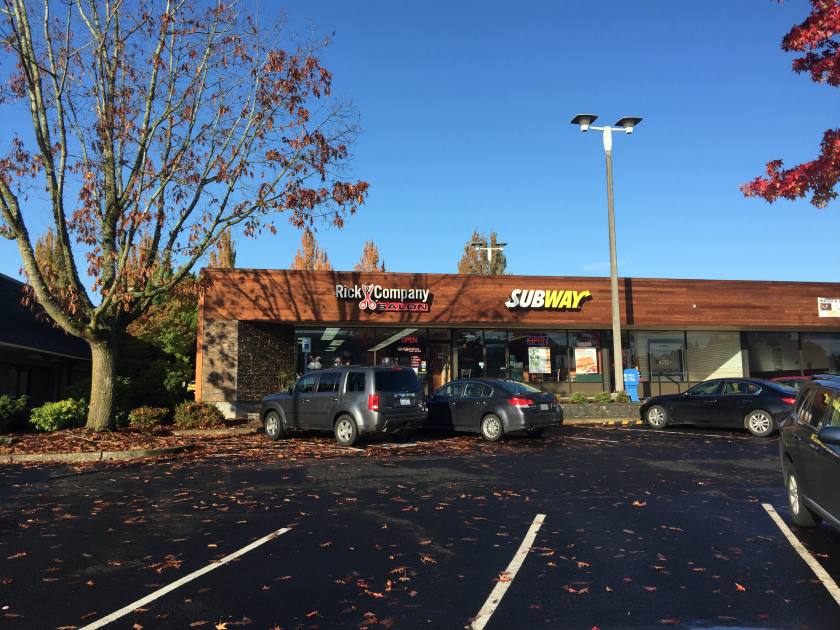
- • Next to Voodoo Doughnuts
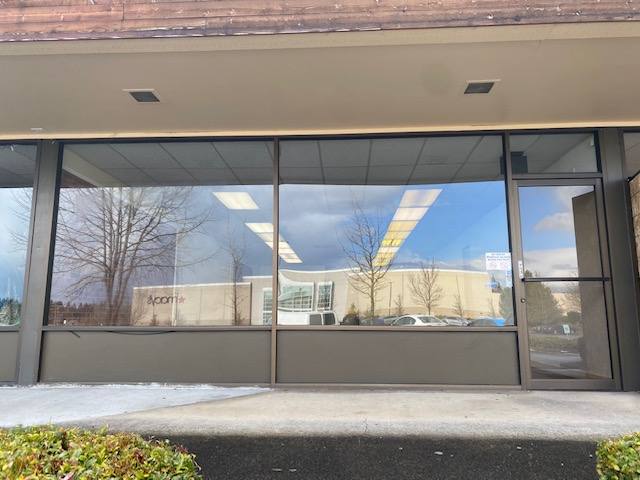
- • Across from the Vancouver Mall
- • High Traffic Shopping Center
- • Facing Chick-Fli-A and Macy's
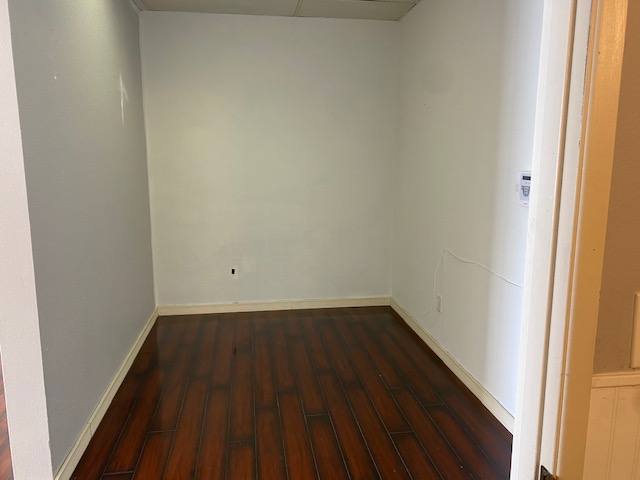
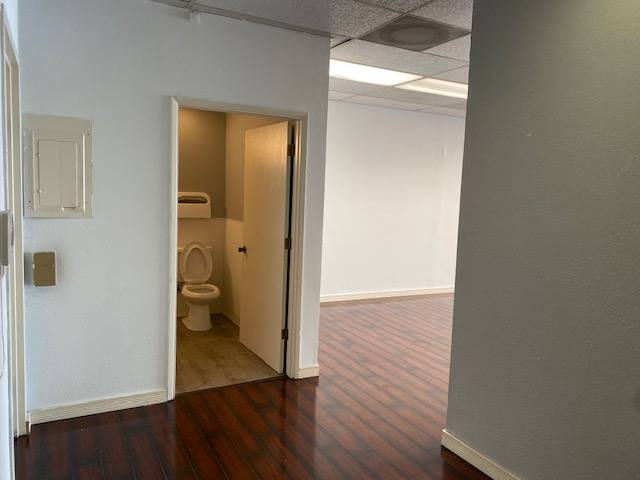
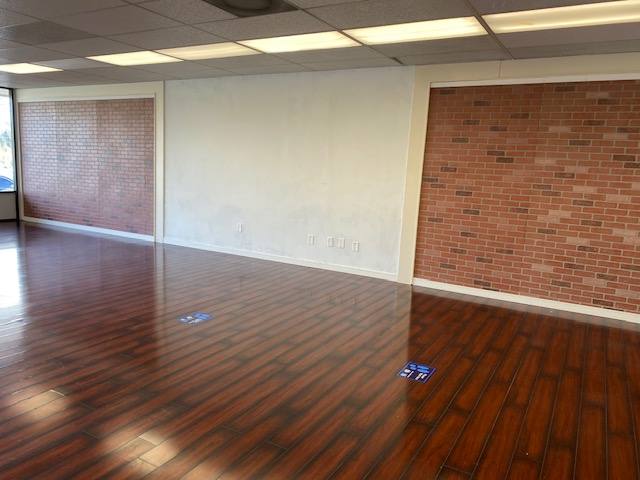
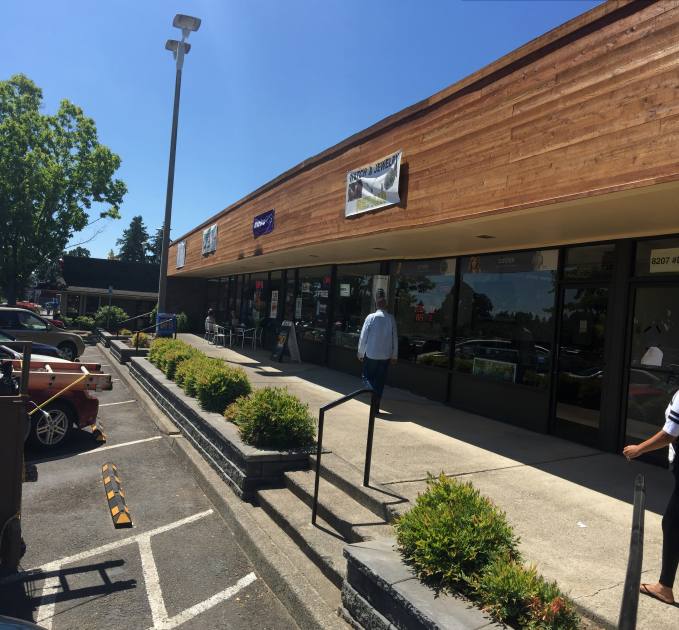
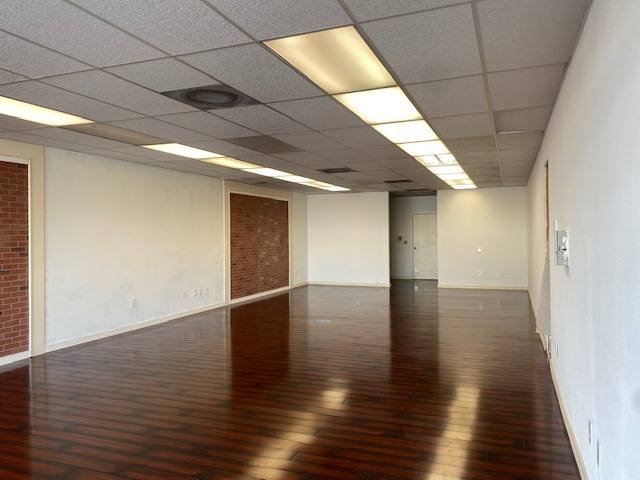
Additional Photos
Listing Agents

Cari Jones
O: 360-694-1031
carijones.tpg@gmail.com
O: 360-694-1031
carijones.tpg@gmail.com
While we strive to provide the most accurate information, all listing information, and demographic data, is provided by third-parties. As such, MyEListing will not be responsible for the accuracy of the information. It is strongly recommended that you verify all information with the listing agent, and any relevant agencies, prior to making any decisions.