Commercial Land
4497 Harrison Avenue Cincinnati, OH 45211
4497 Harrison Avenue Cincinnati, OH 45211

Details & Description
Property Highlights
• Strong Traffic (27,355+); Strong Population (3 mi- 78,959)
• Great Retail Corner Opportunity! Green Twp. / Hamilton Co.
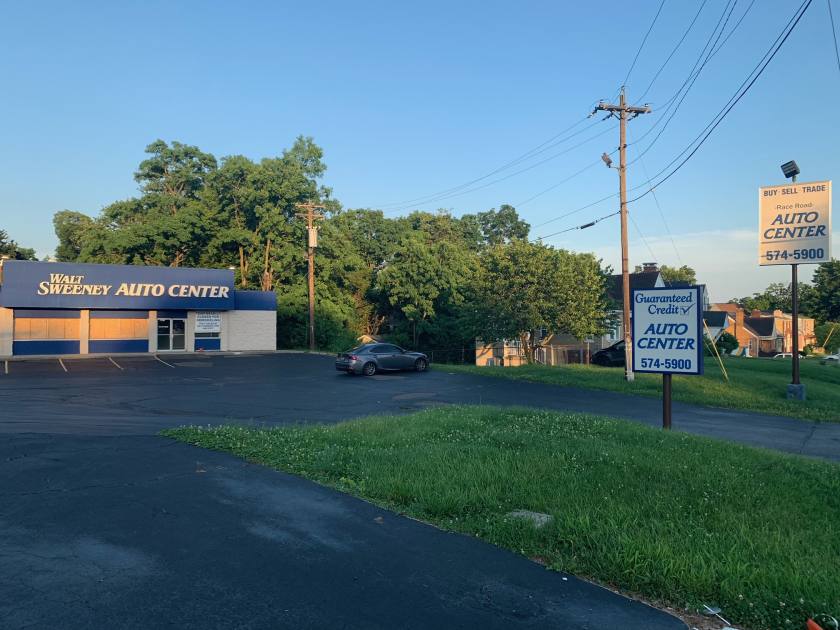
Additional Photos


Listing Agents

David Metz
O: 513-322-6302
M: 513-703-2204
dmetz@bergmancommercial.com
O: 513-322-6302
M: 513-703-2204
dmetz@bergmancommercial.com
While we strive to provide the most accurate information, all listing information, and demographic data, is provided by third-parties. As such, MyEListing will not be responsible for the accuracy of the information. It is strongly recommended that you verify all information with the listing agent, and any relevant agencies, prior to making any decisions.


