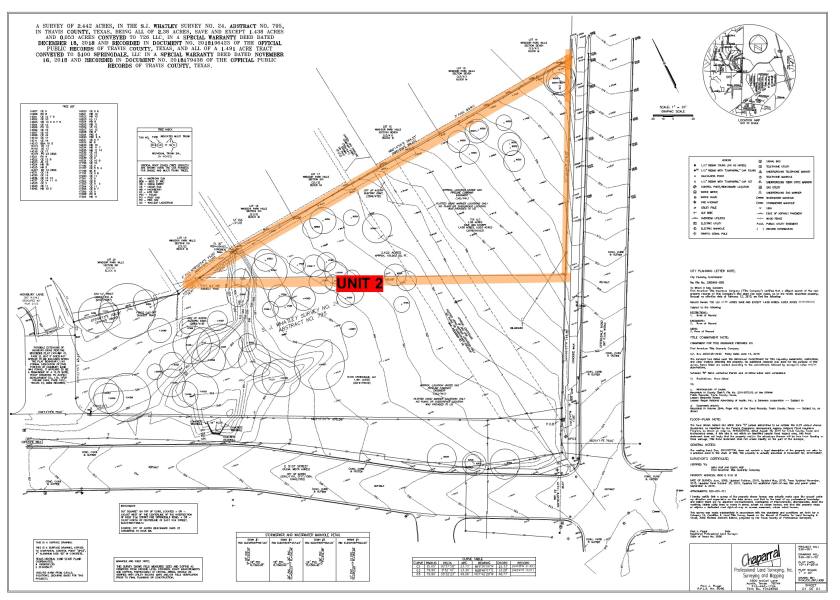
0.897 Acre or 39,057 Sq. Ft. Site in rapidly regentrifying East Austin. Access to Springdale Rd and 51st Street via a Shared Driveway and Curb Cuts. 1.5 mile to Mueller development.• Planned improvements to the site are the shared facilities including driveway and curb cuts, water lines, and detention facilities. Subject property is Phase 2 in the approved site plan SP-2019-0237C, Unit 2 in the condo plat, and is approved for an 11,000 SF building with 33 parking spaces zoned GR-CO-NP.• Accessible from both Springdale Rd and 51st St through shared driveway.• Electricity is available from the adjoining right of way.• Gas line shown on survey was abandoned by Texas Gas years ago, easement has been released and recorded.• A master condominium association, Springdale Commons Commercial Master Condominiums, was formed to avoid having duplicate water & wastewater main lines run through Springdale Rd and 51St St, teeing off to each lot individually. The water lines will be located on the east side of the private property running north-south.• Each master unit in the master condominium association can create sub-condo associations to legally sell off parts of each master unit. For example, the 11,000 sqft office building could be sold as 11 x 1,000 sqft individual business condos.• The association collects no money, has no bank account, and has no direct expenses as the shared maintenance expenses (detention pond and shared water lines) are handled directly between owners as per allocation document.• Additional documentation that is available upon request are the Condo docs, vesting deed, Geotech report, title commitment, Phase 2 fiscal surety for SP-2019-0237C, Phase I environmental site assessment (ESA), Plan set / site plan SP-2019-0237C, Condo plat, Subdivision plat, and Survey