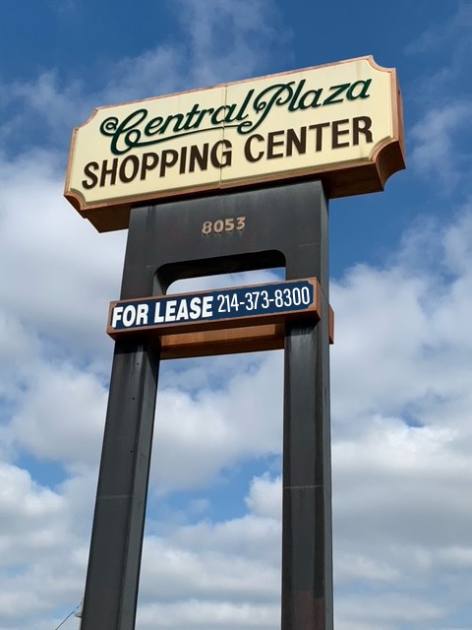
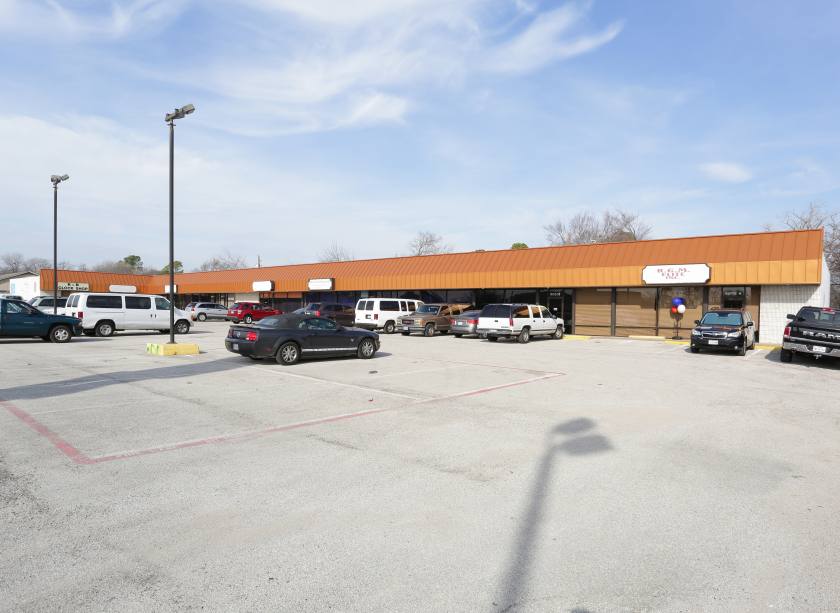
1-Mile | 3-Miles | 5-Miles | ||
---|---|---|---|---|
Total Population | 14,975 | 106,799 | 278,811 | |
Population Median Age | 36 | 39 | 38 | |
Population by Age | 0-9 Yrs | 1614 (10%) | 12801 (11%) | 36647 (13%) |
10-19 Yrs | 2434 (16%) | 13692 (12%) | 38614 (13%) | |
20-29 Yrs | 2517 (16%) | 14559 (13%) | 36506 (13%) | |
30-39 Yrs | 2228 (14%) | 14483 (13%) | 37511 (13%) | |
40-49 Yrs | 2283 (15%) | 13310 (12%) | 36459 (13%) | |
50-59 Yrs | 1338 (8%) | 13233 (12%) | 35886 (12%) | |
60-69 Yrs | 1234 (8%) | 13037 (12%) | 31935 (11%) | |
70+ Yrs | 1328 (8%) | 11685 (10%) | 25253 (9%) | |
Median HH Income | $57,220 | $67,803 | $72,177 | |
Total Household Income | < 24K | 628 (11%) | 4808 (11%) | 11678 (11%) |
25-49K | 1753 (31%) | 9287 (22%) | 21548 (21%) | |
50-74K | 1141 (20%) | 8382 (20%) | 19048 (18%) | |
75-99K | 890 (15%) | 6055 (14%) | 14518 (14%) | |
100-199K | 1092 (19%) | 9934 (24%) | 26558 (26%) | |
200K+ | 86 (1%) | 1970 (4%) | 7149 (7%) | |
Highest Education Level | No Diploma | 1071 | 6586 | 18811 |
Diploma or GED | 2872 | 19169 | 45278 | |
Some College | 2285 | 19121 | 46848 | |
Assoc. Degree | 1000 | 6750 | 17003 | |
Bachelors Degree | 1667 | 15376 | 41028 | |
Higher Degree | 780 | 6600 | 17688 | |
Total Housing Units | 5,922 | 43,004 | 106,422 | |
--Owner-Occupied | 2,198 | 24,909 | 64,081 | |
--Renter-Occupied | 3,393 | 15,527 | 36,418 | |
Owner-Occupied Values | < 100K | 185 | 2168 | 5785 |
100-199K | 1178 | 10611 | 23802 | |
200-299K | 655 | 8093 | 18747 | |
300-399K | 127 | 2441 | 7882 | |
400-499K | 5 | 1057 | 4491 | |
500K+ | 48 | 538 | 3373 | |
Total Working Age Population | 11,529 | 84,932 | 217,453 | |
In Work Force | 8,505 | 58,036 | 149,928 | |
Not In Work Force | 3,024 | 26,896 | 67,524 | |
Workforce Employed | 8,123 | 56,075 | 143,998 | |
Workforce Unemployed | 382 | 1,931 | 5,819 | |
Civlian Workforce | 8,505 | 58,006 | 149,817 | |
Military Workforce | 0 | 30 | 112 | |
Total Households | 5,591 | 40,437 | 100,499 | |
Family Households | 3,629 | 27,183 | 70,760 | |
Non-Family Households | 1,962 | 13,254 | 29,739 | |
Married Couple | 2,343 | 20,244 | 52,918 | |
Other Family | 1,286 | 6,939 | 17,842 | |
Married w/Child | 1,001 | 7,692 | 21,399 | |
Single Male w/Child | 53 | 716 | 2,090 | |
Single Female w/Child | 752 | 2,969 | 7,484 |
Population Change Last Two Decades - Plus Projection
2000 | % | 2010 | % | 2020 | % | 2030 | |
---|---|---|---|---|---|---|---|
Texas | 20,851,820 | +21 | 25,145,561 | +18 | 29,677,668 | +18 | 34,894,452 |
Tarrant County | 1,446,219 | +25 | 1,809,034 | +19 | 2,143,755 | +17 | 2,507,170 |
Total Working Age Population:
Total Households:
Total Working Age Population:
Total Households:
Total Working Age Population:
Total Households: