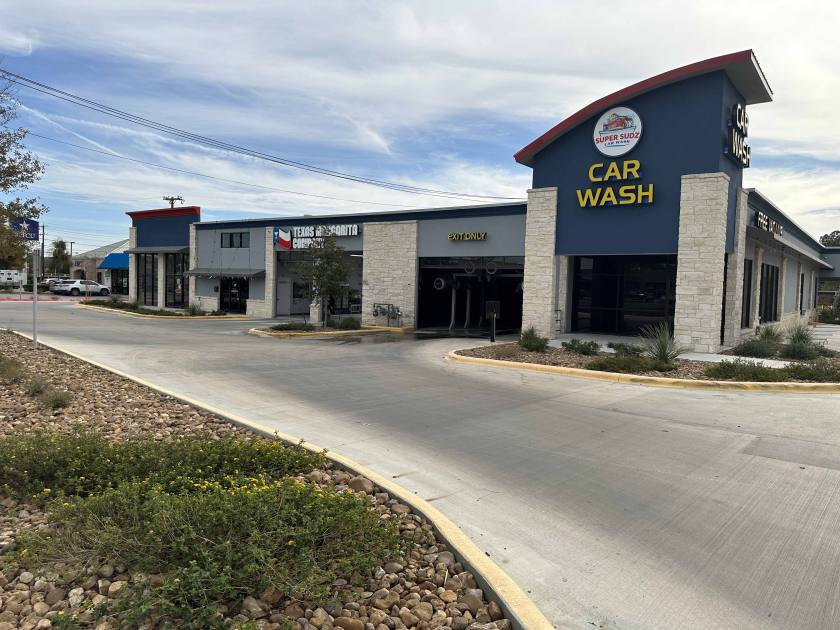
Retail Space
6712 Bandera San Antonio, TX 78238
6712 Bandera San Antonio, TX 78238
Details & Description
Property Highlights
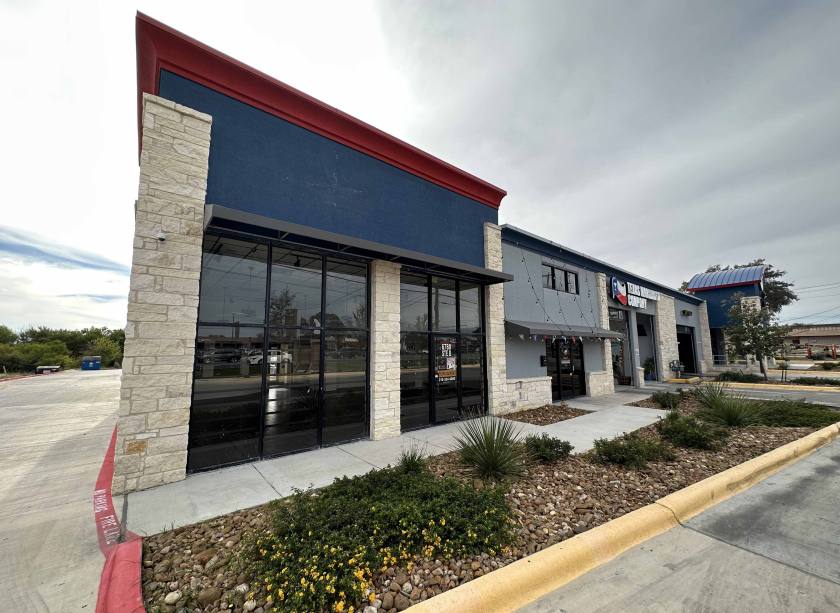
- • Second generation retail space
- • Enjoys high visibility from adjacent thoroughfares
- • Accessible to Loop 410 via Bandera Rd
- • Good ancillary services location
- • Attractive architecture
- • Recently renovated
Listing Agents

Michael Morse
O: 210-524-4000
M: 210-524-1312
mmorse@reocsanantonio.com
O: 210-524-4000
M: 210-524-1312
mmorse@reocsanantonio.com
While we strive to provide the most accurate information, all listing information, and demographic data, is provided by third-parties. As such, MyEListing will not be responsible for the accuracy of the information. It is strongly recommended that you verify all information with the listing agent, and any relevant agencies, prior to making any decisions.