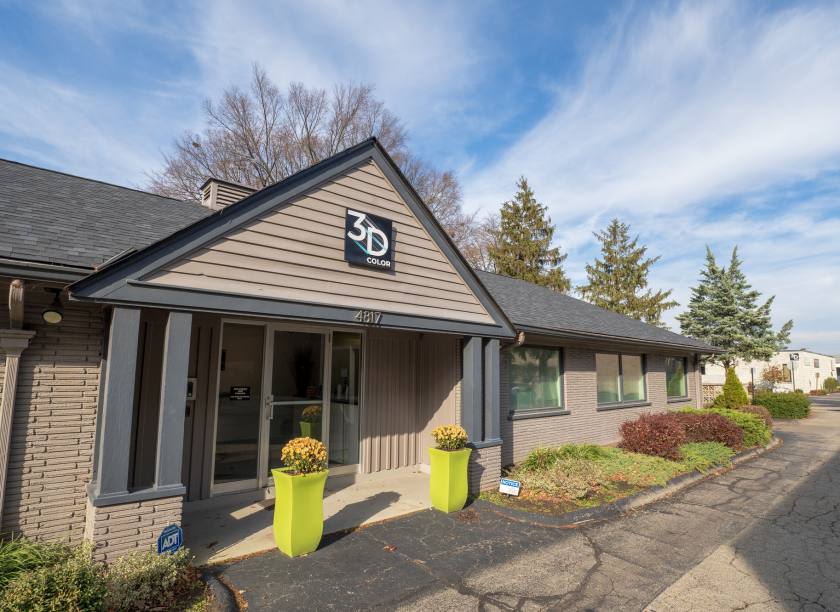
Office Space
4817 Vine Street Cincinnati, OH 45217
4817 Vine Street Cincinnati, OH 45217
Details & Description
Property Highlights
- • 5,982 SF Office/Flex Building For Sale
- • Newer Finishes
- • Easy Access to I-75 and Norwood Lateral
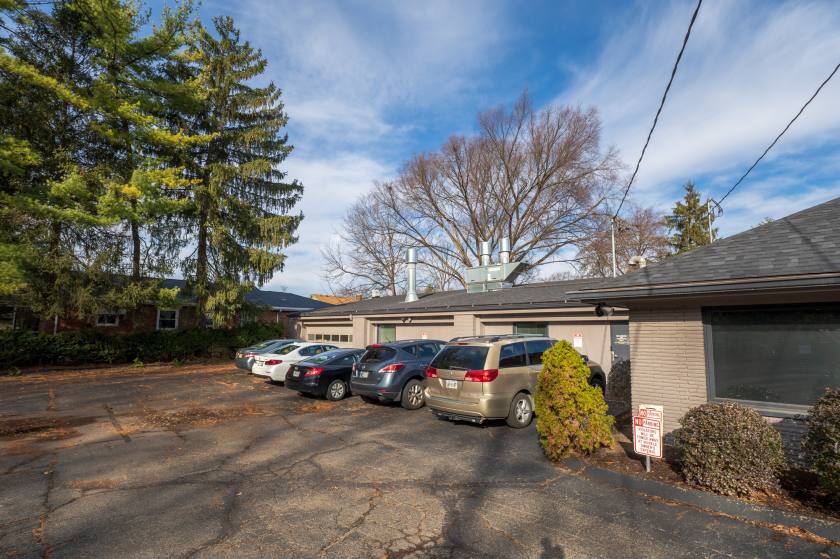
- • Abundance of Parking
- • New Roof and Well Maintained Property
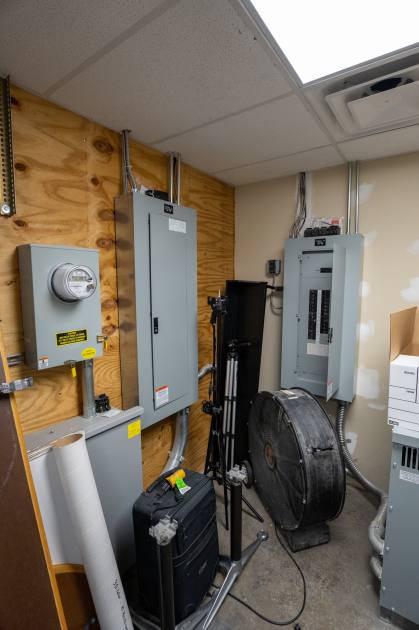
Additional Photos


Listing Agents

Gueorgui Chikov
O: 513-322-6317
M: 513-331-0920
gchikov@bergmancommercial.com
O: 513-322-6317
M: 513-331-0920
gchikov@bergmancommercial.com
While we strive to provide the most accurate information, all listing information, and demographic data, is provided by third-parties. As such, MyEListing will not be responsible for the accuracy of the information. It is strongly recommended that you verify all information with the listing agent, and any relevant agencies, prior to making any decisions.