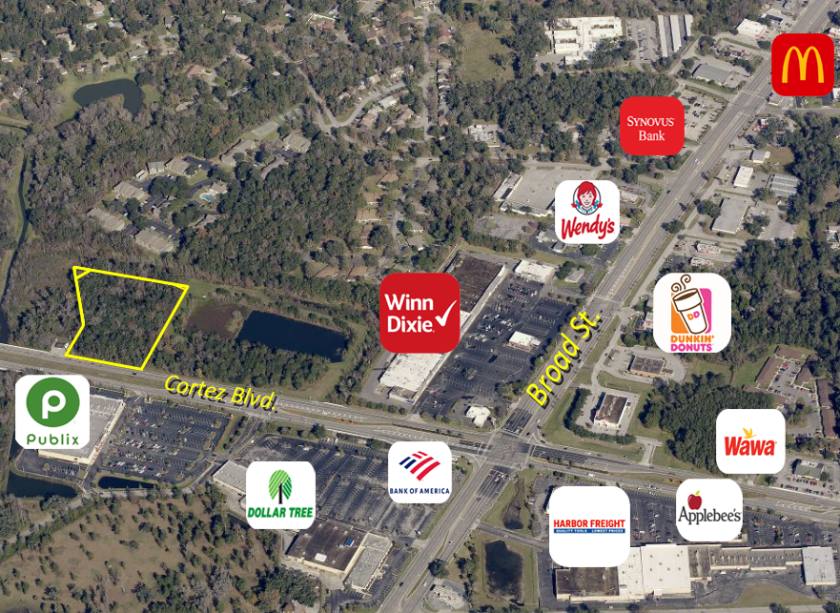
Commercial Land
19301 Cortez Blvd Brooksville, FL 34601
19301 Cortez Blvd Brooksville, FL 34601
Details & Description
Property Highlights
- • PDP GC Zoning.
- • Residential Growth.
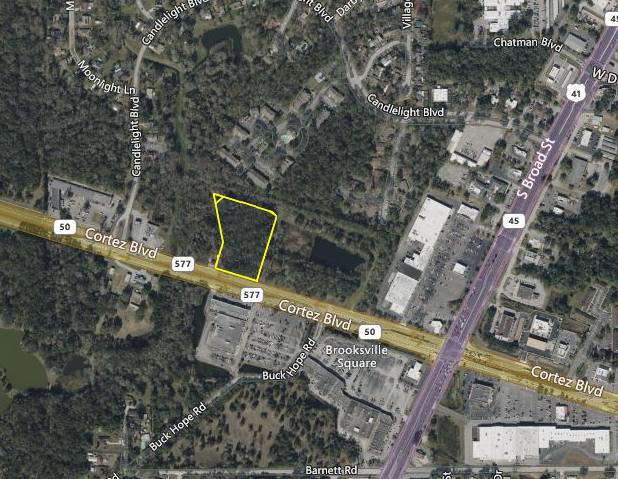
- • Prime transit corridor.
- • AADT 15,500.
- • Publix Shadow.
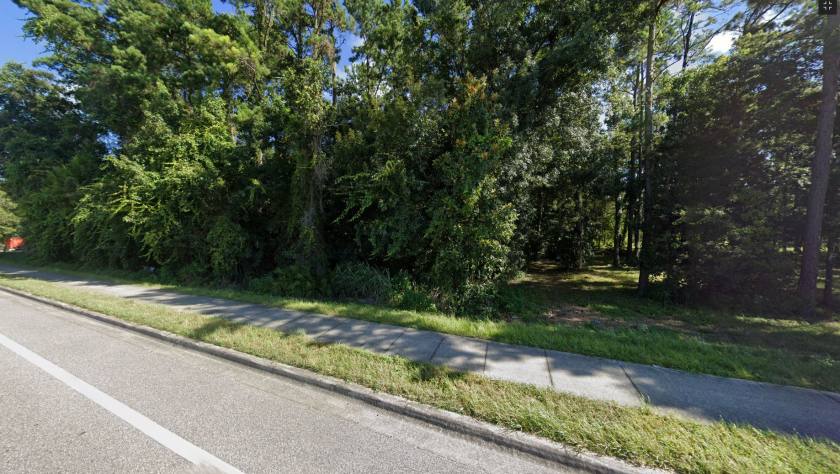
Additional Photos


Listing Agents

Jim Engelmann
O: 727-822-4715
M: 813-508-4981
jim@cprteam.com
O: 727-822-4715
M: 813-508-4981
jim@cprteam.com
While we strive to provide the most accurate information, all listing information, and demographic data, is provided by third-parties. As such, MyEListing will not be responsible for the accuracy of the information. It is strongly recommended that you verify all information with the listing agent, and any relevant agencies, prior to making any decisions.


