Office Space
17250 Dallas Parkway Dallas, TX 75248
17250 Dallas Parkway Dallas, TX 75248

Details & Description
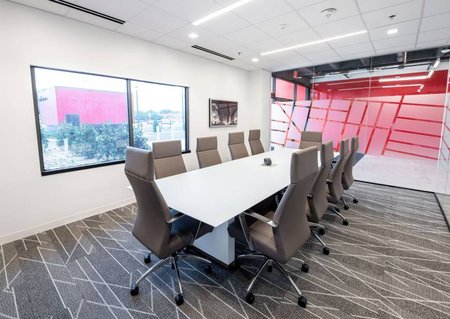
Property Highlights
- • Wi-Fi with a fast internet connection
- • Beautiful natural light
- • Secure 24/7 access to the building
Additional Photos


Listing Agents

City Central
CityCentral
O: 469-513-8489
citycentralnorthdallasaddison@gmail.com
CityCentral
O: 469-513-8489
citycentralnorthdallasaddison@gmail.com
While we strive to provide the most accurate information, all listing information, and demographic data, is provided by third-parties. As such, MyEListing will not be responsible for the accuracy of the information. It is strongly recommended that you verify all information with the listing agent, and any relevant agencies, prior to making any decisions.