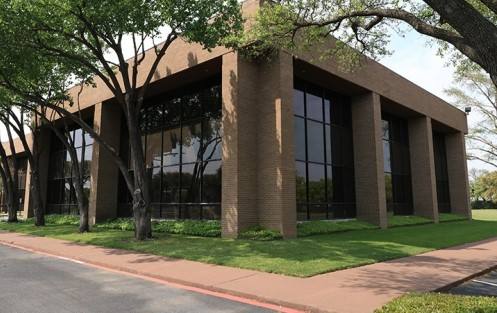
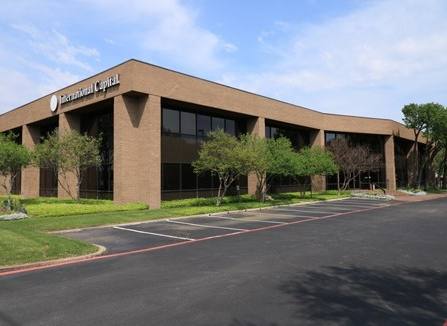
1-Mile | 3-Miles | 5-Miles | ||
---|---|---|---|---|
Total Population | 2,731 | 46,573 | 123,175 | |
Population Median Age | 38 | 36 | 36 | |
Population by Age | 0-9 Yrs | 393 (14%) | 6865 (14%) | 18492 (15%) |
10-19 Yrs | 406 (14%) | 8178 (17%) | 19386 (15%) | |
20-29 Yrs | 329 (12%) | 5988 (12%) | 16303 (13%) | |
30-39 Yrs | 325 (11%) | 5300 (11%) | 15425 (12%) | |
40-49 Yrs | 285 (10%) | 6006 (12%) | 14559 (11%) | |
50-59 Yrs | 370 (13%) | 5901 (12%) | 15870 (12%) | |
60-69 Yrs | 451 (16%) | 4631 (9%) | 11819 (9%) | |
70+ Yrs | 173 (6%) | 3706 (7%) | 11322 (9%) | |
Median HH Income | $57,175 | $51,457 | $44,050 | |
Total Household Income | < 24K | 156 (15%) | 3794 (23%) | 12414 (29%) |
25-49K | 298 (28%) | 3879 (24%) | 10909 (25%) | |
50-74K | 331 (31%) | 3731 (23%) | 8299 (19%) | |
75-99K | 100 (9%) | 1872 (11%) | 4945 (11%) | |
100-199K | 155 (14%) | 2402 (15%) | 5407 (12%) | |
200K+ | 1 (0%) | 246 (1%) | 654 (1%) | |
Highest Education Level | No Diploma | 284 | 4604 | 14881 |
Diploma or GED | 573 | 8460 | 25415 | |
Some College | 562 | 8045 | 19898 | |
Assoc. Degree | 76 | 2745 | 5283 | |
Bachelors Degree | 255 | 3771 | 8705 | |
Higher Degree | 137 | 1569 | 4170 | |
Total Housing Units | 1,064 | 16,770 | 45,462 | |
--Owner-Occupied | 762 | 10,179 | 24,643 | |
--Renter-Occupied | 277 | 5,744 | 17,983 | |
Owner-Occupied Values | < 100K | 351 | 3504 | 9770 |
100-199K | 319 | 5112 | 10847 | |
200-299K | 76 | 1300 | 3167 | |
300-399K | 0 | 120 | 351 | |
400-499K | 0 | 19 | 112 | |
500K+ | 15 | 124 | 397 | |
Total Working Age Population | 2,087 | 34,332 | 91,958 | |
In Work Force | 1,302 | 21,939 | 54,252 | |
Not In Work Force | 785 | 12,394 | 37,706 | |
Workforce Employed | 1,227 | 20,708 | 51,149 | |
Workforce Unemployed | 75 | 1,228 | 3,081 | |
Civlian Workforce | 1,302 | 21,935 | 54,230 | |
Military Workforce | 0 | 3 | 22 | |
Total Households | 1,039 | 15,923 | 42,627 | |
Family Households | 666 | 11,016 | 28,353 | |
Non-Family Households | 373 | 4,907 | 14,274 | |
Married Couple | 340 | 5,752 | 14,004 | |
Other Family | 326 | 5,264 | 14,349 | |
Married w/Child | 112 | 2,425 | 5,360 | |
Single Male w/Child | 12 | 407 | 1,104 | |
Single Female w/Child | 180 | 2,735 | 6,546 |
Population Change Last Two Decades - Plus Projection
2000 | % | 2010 | % | 2020 | % | 2030 | |
---|---|---|---|---|---|---|---|
Texas | 20,851,820 | +21 | 25,145,561 | +18 | 29,677,668 | +18 | 34,894,452 |
Dallas County | 2,218,899 | +7 | 2,368,139 | +15 | 2,734,111 | +14 | 3,106,298 |
Total Working Age Population:
Total Households:
Total Working Age Population:
Total Households:
Total Working Age Population:
Total Households: