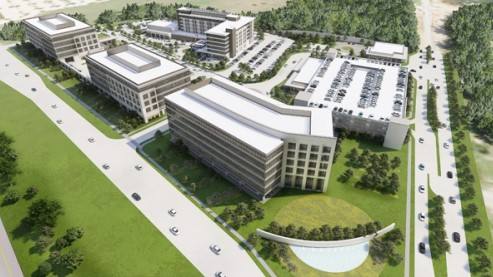
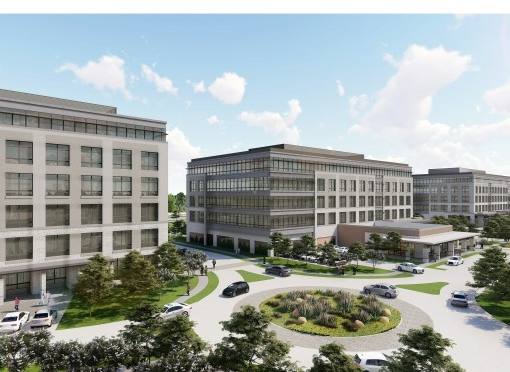
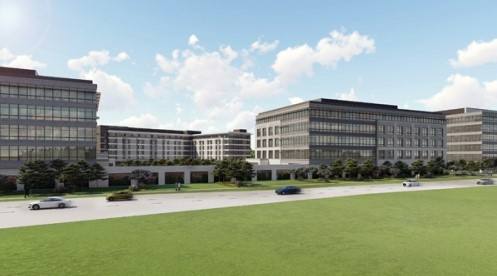
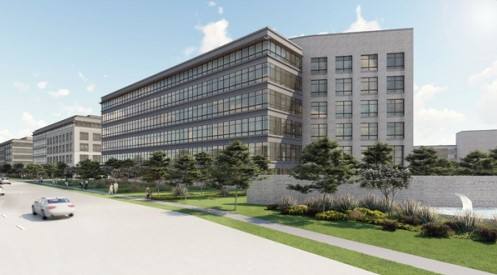
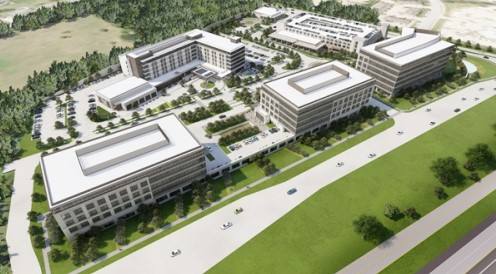
1-Mile | 3-Miles | 5-Miles | ||
---|---|---|---|---|
Total Population | 4,697 | 41,339 | 123,068 | |
Population Median Age | 34 | 37 | 39 | |
Population by Age | 0-9 Yrs | 828 (17%) | 5585 (13%) | 15920 (12%) |
10-19 Yrs | 1043 (22%) | 8048 (19%) | 20182 (16%) | |
20-29 Yrs | 200 (4%) | 2562 (6%) | 10150 (8%) | |
30-39 Yrs | 321 (6%) | 3621 (8%) | 12447 (10%) | |
40-49 Yrs | 1006 (21%) | 7163 (17%) | 18462 (15%) | |
50-59 Yrs | 641 (13%) | 7402 (17%) | 21873 (17%) | |
60-69 Yrs | 377 (8%) | 4477 (10%) | 14189 (11%) | |
70+ Yrs | 280 (5%) | 2480 (5%) | 9844 (7%) | |
Median HH Income | $200000+ | $192,212 | $144,563 | |
Total Household Income | < 24K | 34 (2%) | 528 (4%) | 2493 (5%) |
25-49K | 60 (4%) | 717 (5%) | 3727 (8%) | |
50-74K | 47 (3%) | 933 (7%) | 4804 (11%) | |
75-99K | 148 (11%) | 891 (6%) | 3828 (9%) | |
100-199K | 239 (18%) | 3608 (28%) | 12860 (30%) | |
200K+ | 741 (58%) | 6094 (47%) | 14583 (34%) | |
Highest Education Level | No Diploma | 32 | 354 | 3234 |
Diploma or GED | 358 | 2811 | 9779 | |
Some College | 286 | 3878 | 14558 | |
Assoc. Degree | 143 | 1530 | 5095 | |
Bachelors Degree | 1073 | 10729 | 31844 | |
Higher Degree | 824 | 7155 | 17305 | |
Total Housing Units | 1,331 | 13,151 | 43,613 | |
--Owner-Occupied | 1,190 | 11,596 | 33,893 | |
--Renter-Occupied | 79 | 1,175 | 8,401 | |
Owner-Occupied Values | < 100K | 42 | 273 | 1197 |
100-199K | 22 | 175 | 1069 | |
200-299K | 9 | 742 | 3775 | |
300-399K | 63 | 1298 | 5678 | |
400-499K | 58 | 1195 | 5457 | |
500K+ | 996 | 7914 | 16717 | |
Total Working Age Population | 3,114 | 30,167 | 94,063 | |
In Work Force | 1,882 | 19,644 | 64,459 | |
Not In Work Force | 1,232 | 10,523 | 29,604 | |
Workforce Employed | 1,864 | 19,105 | 61,797 | |
Workforce Unemployed | 18 | 536 | 2,584 | |
Civlian Workforce | 1,882 | 19,641 | 64,381 | |
Military Workforce | 0 | 3 | 78 | |
Total Households | 1,269 | 12,771 | 42,294 | |
Family Households | 1,209 | 11,217 | 33,261 | |
Non-Family Households | 60 | 1,553 | 9,033 | |
Married Couple | 1,075 | 10,134 | 29,384 | |
Other Family | 135 | 1,084 | 3,877 | |
Married w/Child | 704 | 5,449 | 13,951 | |
Single Male w/Child | 52 | 271 | 768 | |
Single Female w/Child | 34 | 299 | 1,215 |
Population Change Last Two Decades - Plus Projection
2000 | % | 2010 | % | 2020 | % | 2030 | |
---|---|---|---|---|---|---|---|
Texas | 20,851,820 | +21 | 25,145,561 | +18 | 29,677,668 | +18 | 34,894,452 |
Tarrant County | 1,446,219 | +25 | 1,809,034 | +19 | 2,143,755 | +17 | 2,507,170 |
Denton County | 432,976 | +53 | 662,614 | +36 | 897,953 | +37 | 1,234,110 |
Total Working Age Population:
Total Households:
Total Working Age Population:
Total Households:
Total Working Age Population:
Total Households: