Office Space
2626 Howell Street Dallas, TX 75204
2626 Howell Street Dallas, TX 75204

Details & Description
Property Highlights
- • In the heart of Uptown
- • Outstanding views
- • Easily accessible to four major highways
- • On?site property management & security
- • Covered parking with card key access
- • Seconds from the Free McKinney Trolley
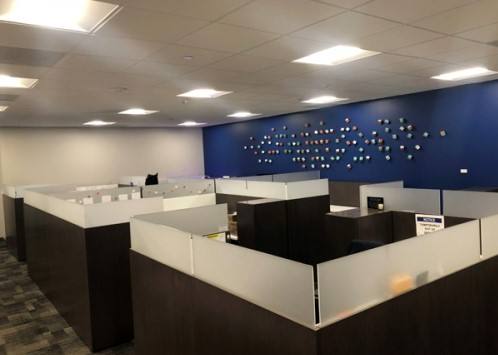
Additional Photos


Listing Agents

Tracy Fults
O: 972-503-5100
M: 972-674-3429
tracy.fults@fults.com
O: 972-503-5100
M: 972-674-3429
tracy.fults@fults.com

Louie Weber
Fults
O: 972-674-3432
M: 214-738-2034
louis.weber@fults.com
Fults
O: 972-674-3432
M: 214-738-2034
louis.weber@fults.com
While we strive to provide the most accurate information, all listing information, and demographic data, is provided by third-parties. As such, MyEListing will not be responsible for the accuracy of the information. It is strongly recommended that you verify all information with the listing agent, and any relevant agencies, prior to making any decisions.


