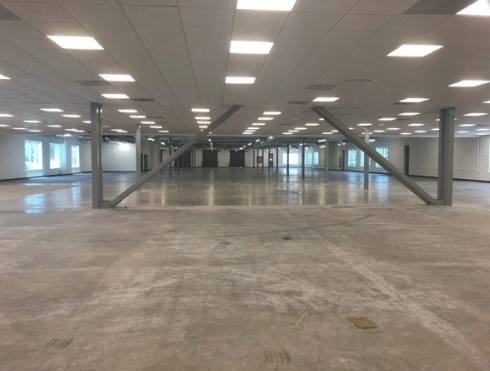
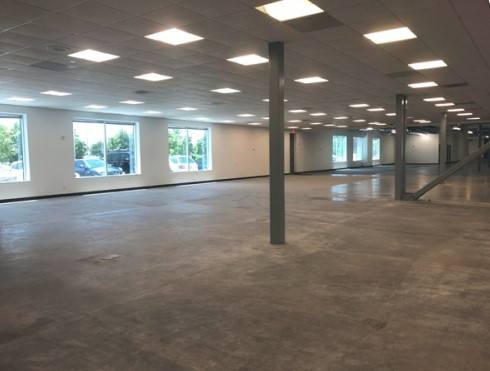
1-Mile | 3-Miles | 5-Miles | ||
---|---|---|---|---|
Total Population | 6,115 | 92,618 | 311,280 | |
Population Median Age | 36 | 38 | 38 | |
Population by Age | 0-9 Yrs | 302 (4%) | 9645 (10%) | 34988 (11%) |
10-19 Yrs | 779 (12%) | 9937 (10%) | 38584 (12%) | |
20-29 Yrs | 1394 (22%) | 14633 (15%) | 41991 (13%) | |
30-39 Yrs | 828 (13%) | 15810 (17%) | 49134 (15%) | |
40-49 Yrs | 1384 (22%) | 13376 (14%) | 49349 (15%) | |
50-59 Yrs | 827 (13%) | 13253 (14%) | 44352 (14%) | |
60-69 Yrs | 513 (8%) | 9586 (10%) | 30721 (9%) | |
70+ Yrs | 87 (1%) | 6378 (6%) | 22162 (7%) | |
Median HH Income | $81,878 | $98,145 | $95,997 | |
Total Household Income | < 24K | 323 (10%) | 2794 (6%) | 11002 (8%) |
25-49K | 557 (17%) | 5449 (13%) | 19296 (15%) | |
50-74K | 551 (17%) | 5975 (14%) | 19112 (15%) | |
75-99K | 666 (20%) | 6659 (16%) | 16579 (13%) | |
100-199K | 640 (19%) | 11710 (28%) | 38973 (30%) | |
200K+ | 491 (15%) | 8180 (20%) | 21710 (17%) | |
Highest Education Level | No Diploma | 33 | 1271 | 7707 |
Diploma or GED | 595 | 6268 | 26512 | |
Some College | 760 | 9586 | 37906 | |
Assoc. Degree | 244 | 3558 | 14763 | |
Bachelors Degree | 1855 | 27851 | 83013 | |
Higher Degree | 926 | 18942 | 50504 | |
Total Housing Units | 3,660 | 44,171 | 136,702 | |
--Owner-Occupied | 526 | 16,854 | 66,039 | |
--Renter-Occupied | 2,703 | 23,914 | 60,633 | |
Owner-Occupied Values | < 100K | 5 | 121 | 966 |
100-199K | 8 | 386 | 5059 | |
200-299K | 2 | 1571 | 13955 | |
300-399K | 22 | 3146 | 18478 | |
400-499K | 80 | 3766 | 11828 | |
500K+ | 410 | 7864 | 15753 | |
Total Working Age Population | 5,253 | 76,496 | 252,045 | |
In Work Force | 4,498 | 55,710 | 183,198 | |
Not In Work Force | 755 | 20,786 | 68,847 | |
Workforce Employed | 4,279 | 53,674 | 176,073 | |
Workforce Unemployed | 196 | 1,976 | 6,879 | |
Civlian Workforce | 4,475 | 55,650 | 182,952 | |
Military Workforce | 23 | 60 | 246 | |
Total Households | 3,229 | 40,768 | 126,672 | |
Family Households | 1,309 | 24,343 | 81,061 | |
Non-Family Households | 1,920 | 16,425 | 45,612 | |
Married Couple | 918 | 21,052 | 66,166 | |
Other Family | 390 | 3,291 | 14,895 | |
Married w/Child | 339 | 9,586 | 31,626 | |
Single Male w/Child | 145 | 430 | 1,882 | |
Single Female w/Child | 46 | 1,472 | 6,372 |
Population Change Last Two Decades - Plus Projection
2000 | % | 2010 | % | 2020 | % | 2030 | |
---|---|---|---|---|---|---|---|
Texas | 20,851,820 | +21 | 25,145,561 | +18 | 29,677,668 | +18 | 34,894,452 |
Denton County | 432,976 | +53 | 662,614 | +36 | 897,953 | +37 | 1,234,110 |
Collin County | 491,675 | +59 | 782,341 | +33 | 1,039,369 | +34 | 1,391,461 |
Total Working Age Population:
Total Households:
Total Working Age Population:
Total Households:
Total Working Age Population:
Total Households: