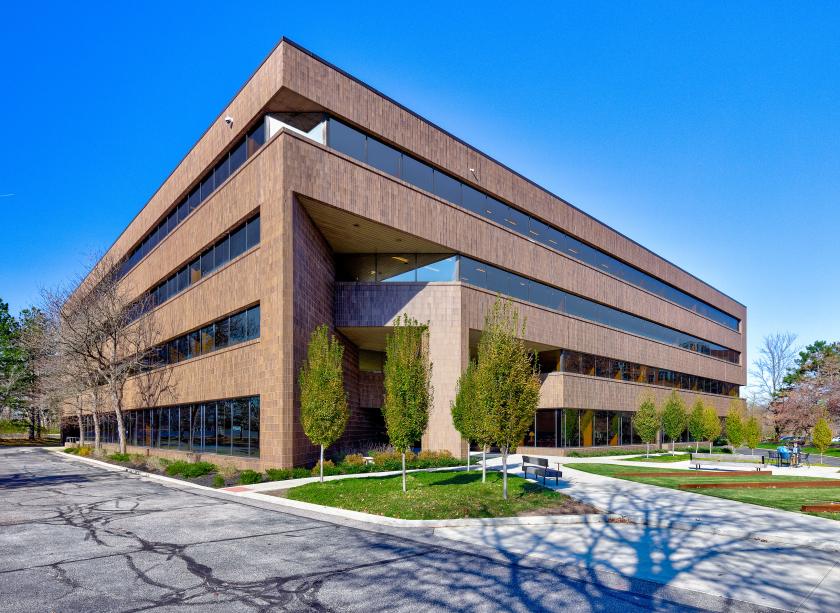
Office Space
6060 Rockside Woods Boulevard North Independence, OH 44131
6060 Rockside Woods Boulevard North Independence, OH 44131
Details & Description
Property Highlights
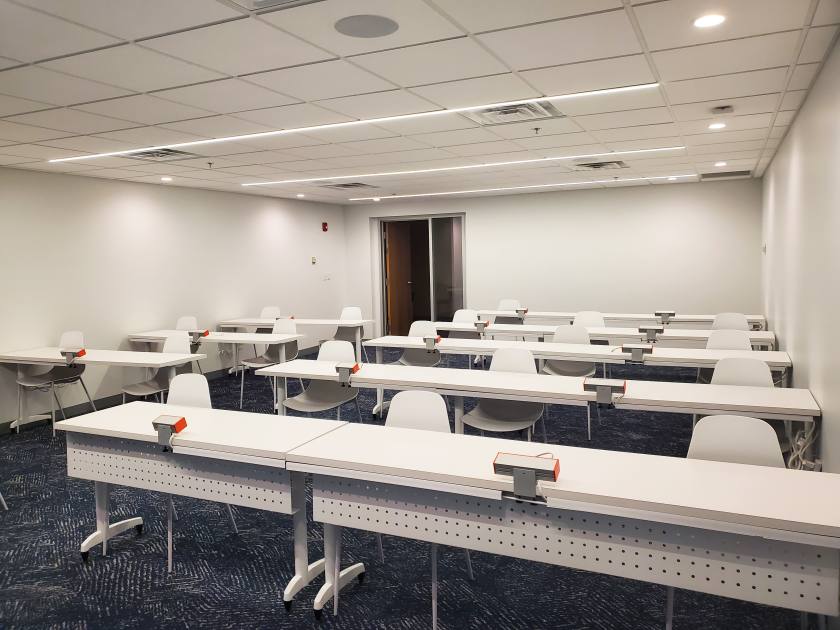
- • 2 Suites Available
- • $21.50/SF FSG
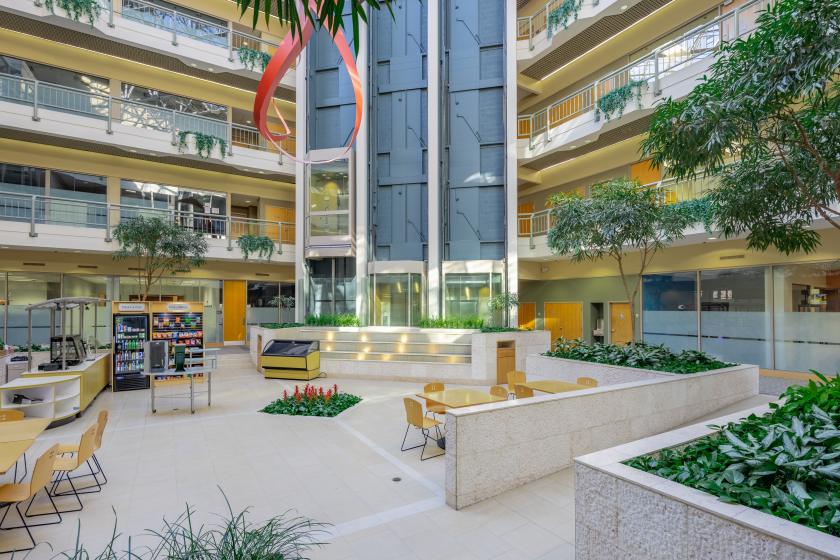
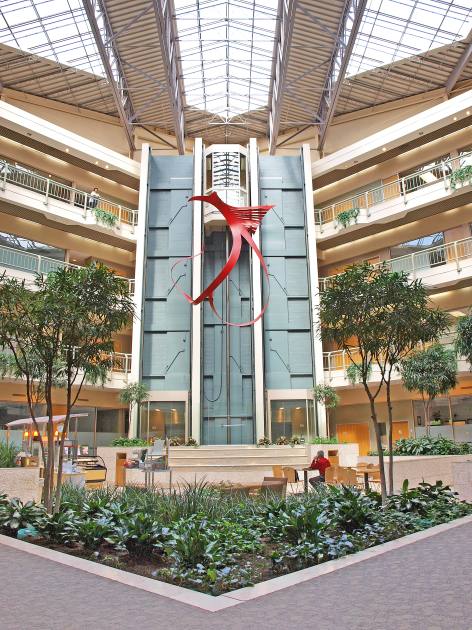
- • Community Greenscape Plaza coming soon
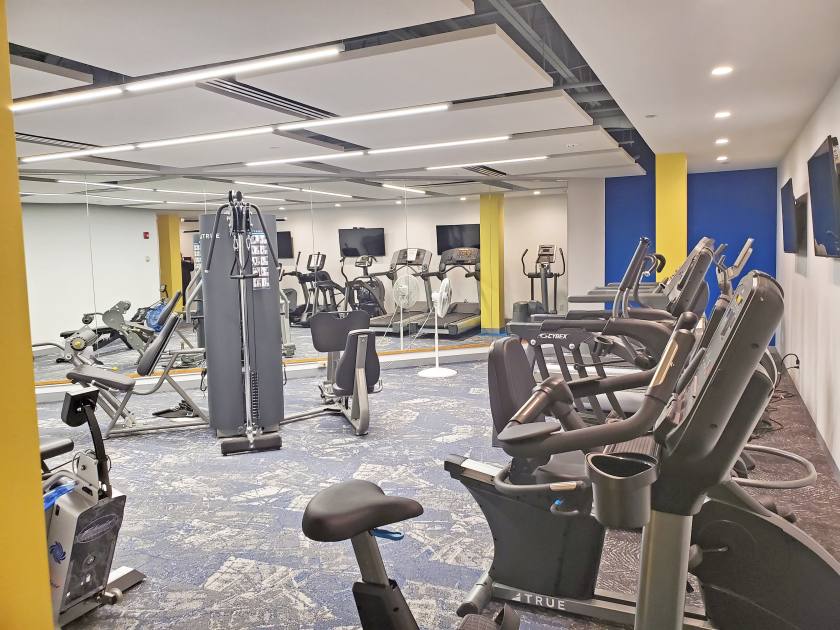
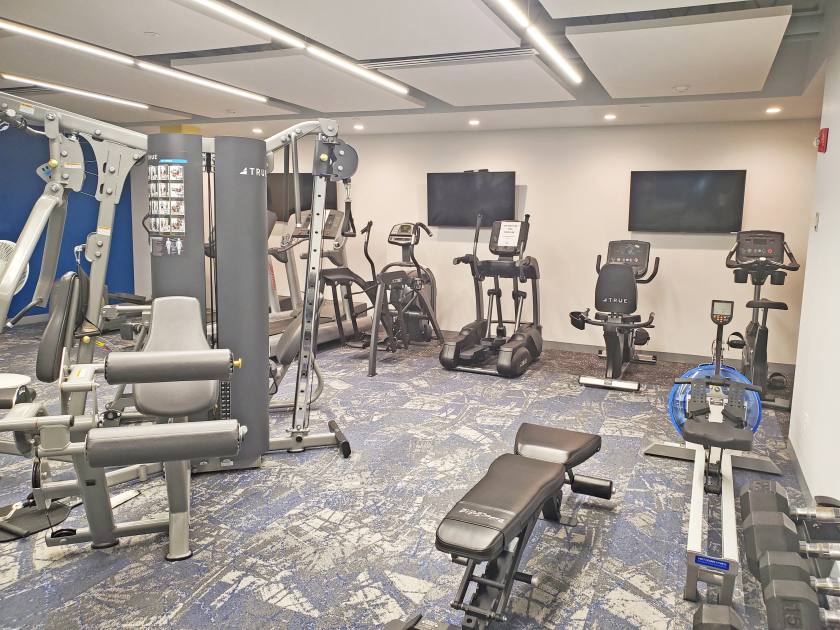
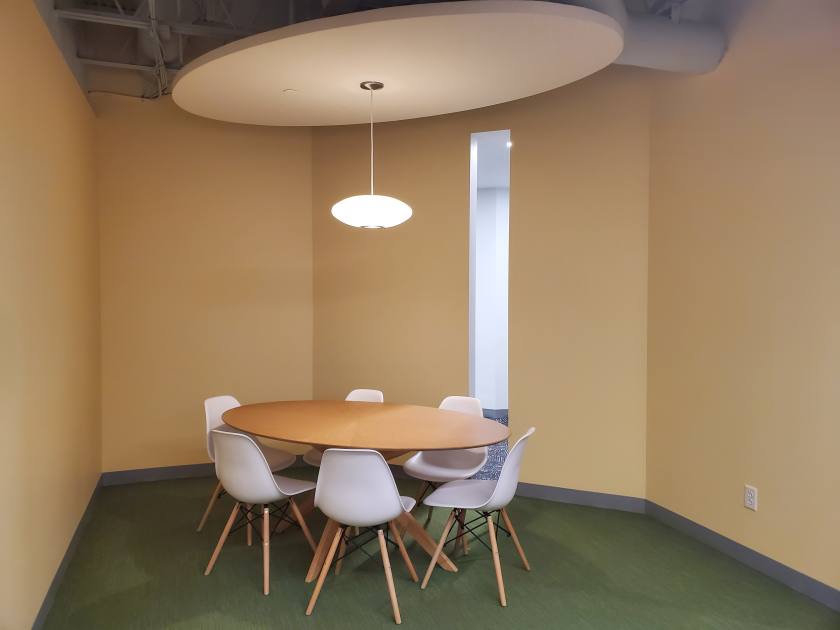
Additional Photos
Listing Agents

Alec J. Pacella
O: 216-455-0925
M: 216-235-1419
apacella@naipvc.com
O: 216-455-0925
M: 216-235-1419
apacella@naipvc.com
While we strive to provide the most accurate information, all listing information, and demographic data, is provided by third-parties. As such, MyEListing will not be responsible for the accuracy of the information. It is strongly recommended that you verify all information with the listing agent, and any relevant agencies, prior to making any decisions.