Industrial Properties
120 South Lake Street Montgomery, IL 60538
120 South Lake Street Montgomery, IL 60538

Details & Description
Property Highlights
• Property has re-development potential for commercial/light industrial
• Three existing curb cuts, two on Route 31 & one on Aucutt
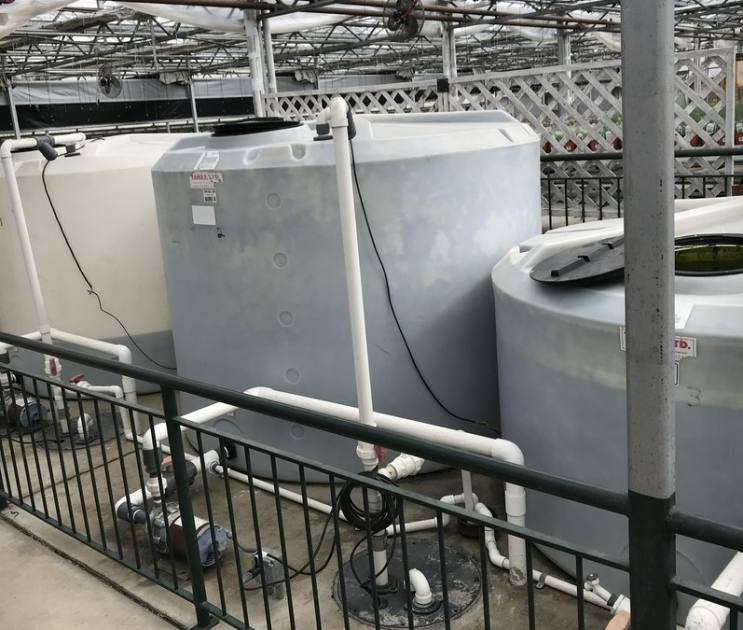
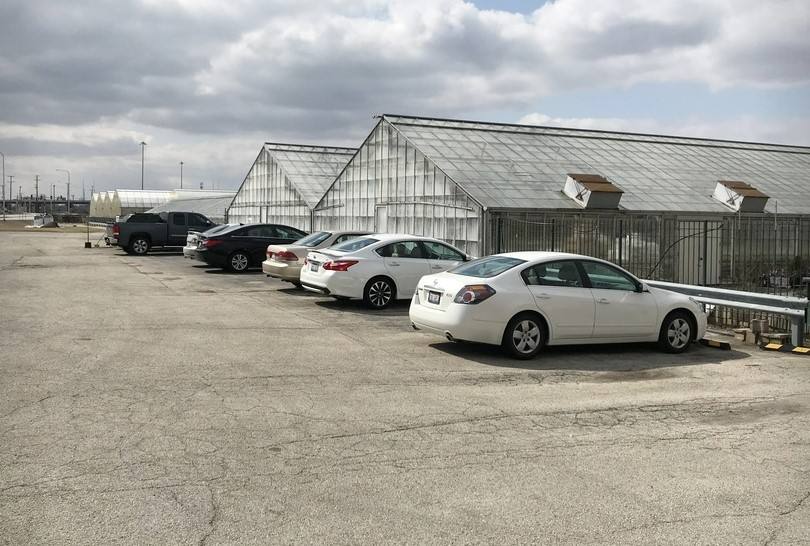
Additional Photos

Listing Agents

Brian Dolan
O: 630-801-8800
M: 630-774-8524
bk.dolanmurphyteam@catoncommercial.com
O: 630-801-8800
M: 630-774-8524
bk.dolanmurphyteam@catoncommercial.com

Dan J. Dolan
O: 630-801-8800
M: 630-885-5785
dj.dolanmurphyteam@catoncommercial.com
O: 630-801-8800
M: 630-885-5785
dj.dolanmurphyteam@catoncommercial.com
While we strive to provide the most accurate information, all listing information, and demographic data, is provided by third-parties. As such, MyEListing will not be responsible for the accuracy of the information. It is strongly recommended that you verify all information with the listing agent, and any relevant agencies, prior to making any decisions.


