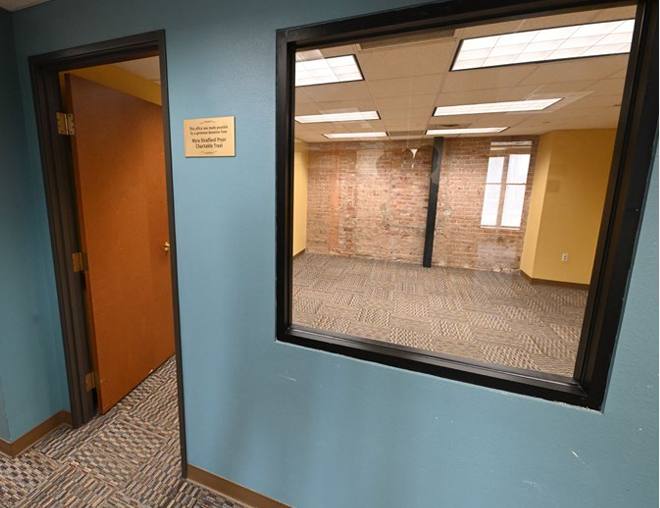
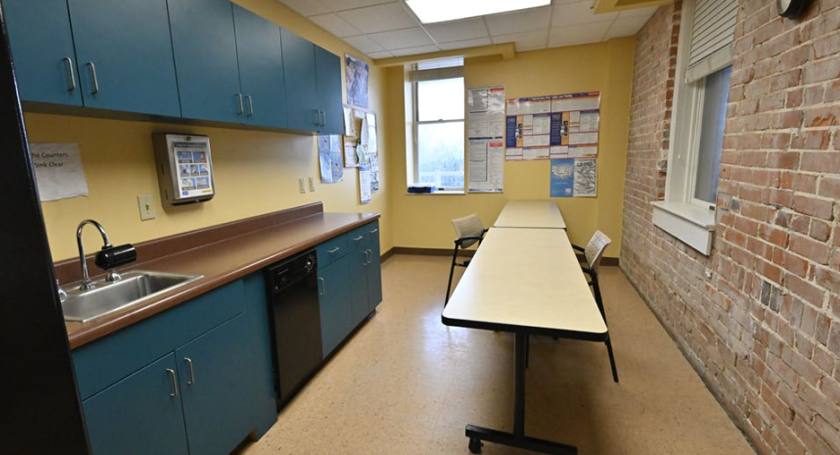
Office Space
118 North Medina Street San Antonio, TX 78207
118 North Medina Street San Antonio, TX 78207
Details & Description
Property Highlights
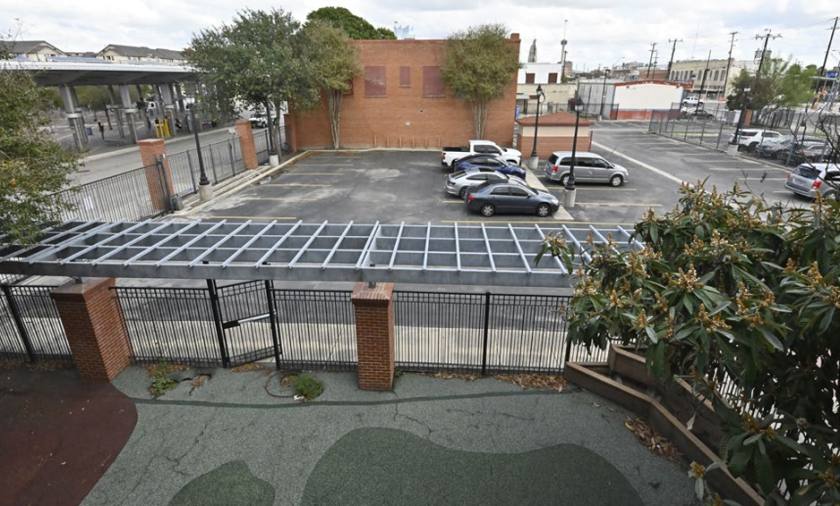
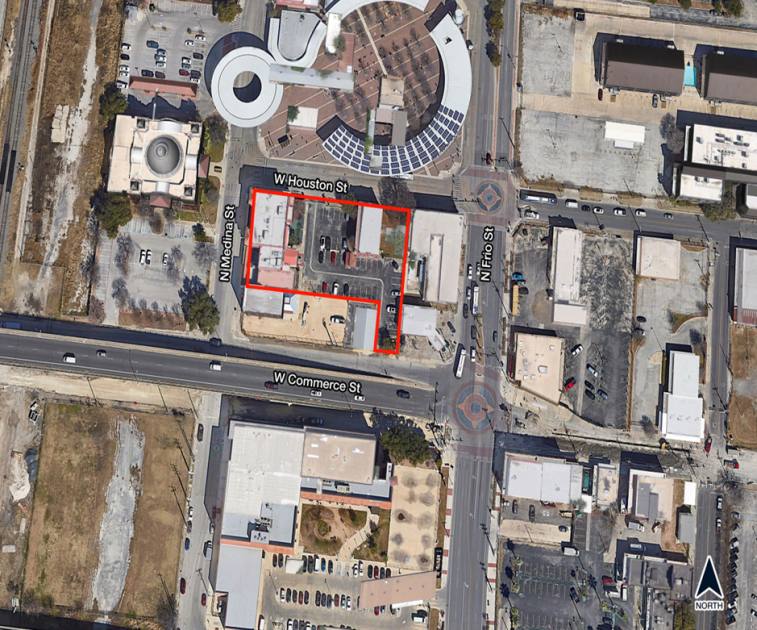
- • Excellent visibility
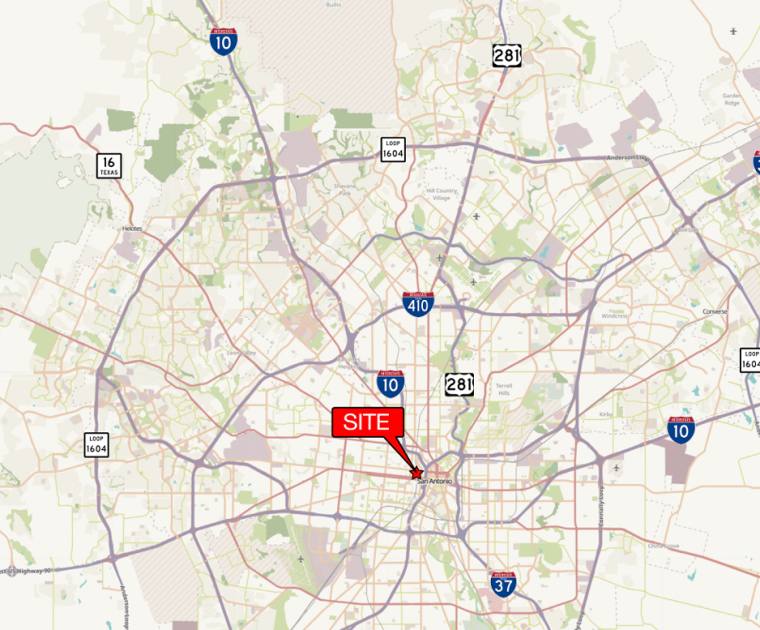
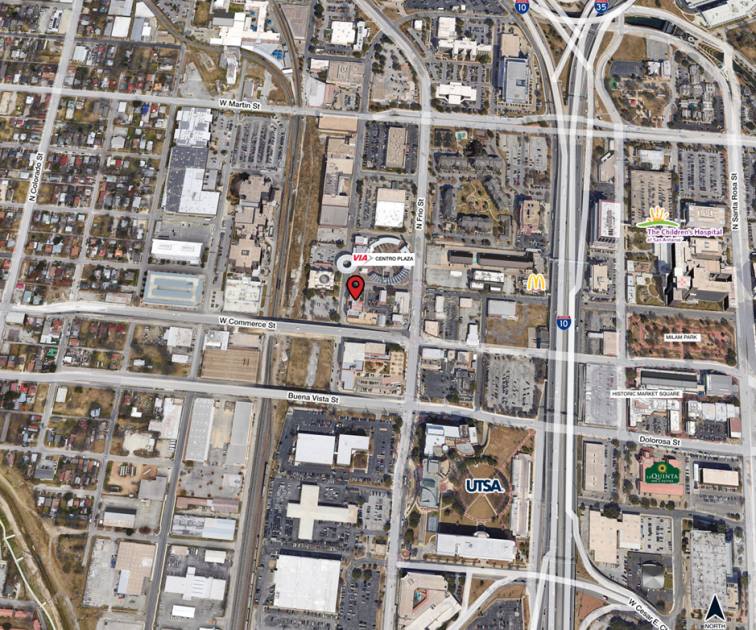
- • Accessible to downtown and the airport
- • Well located across from west side Inter-model HUB
- • Easy ingress/egress to adjacent thoroughfares
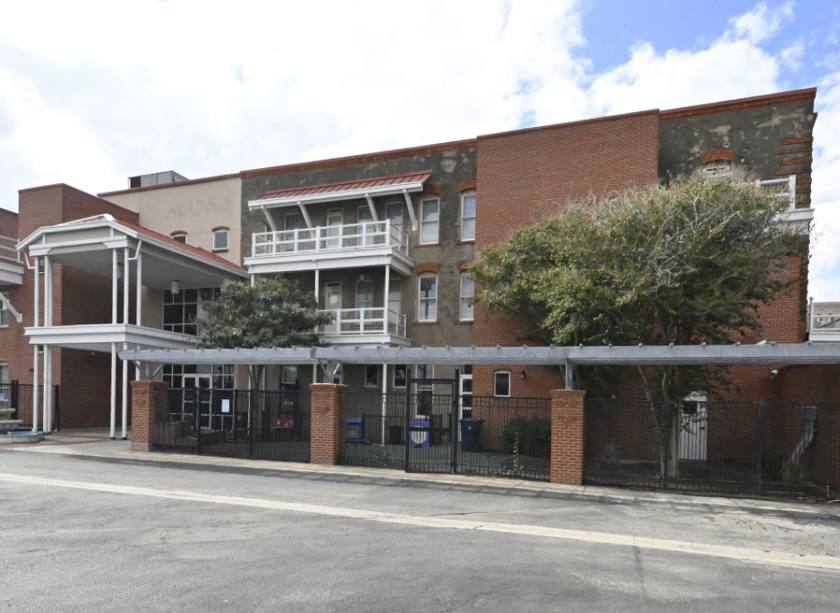
- • Fenced yard
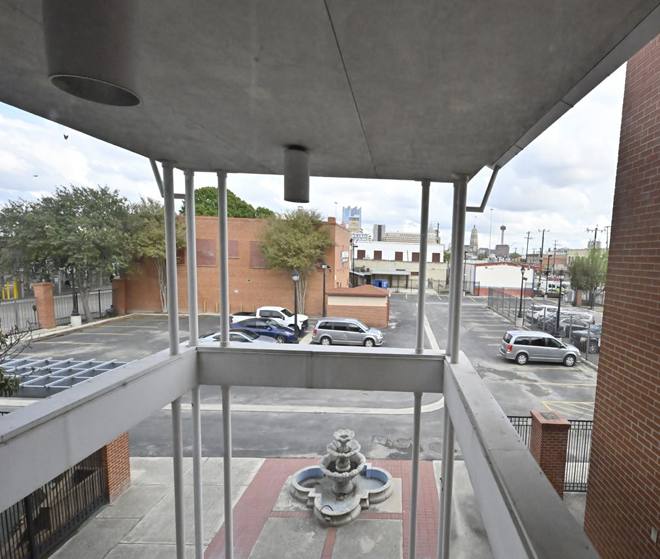
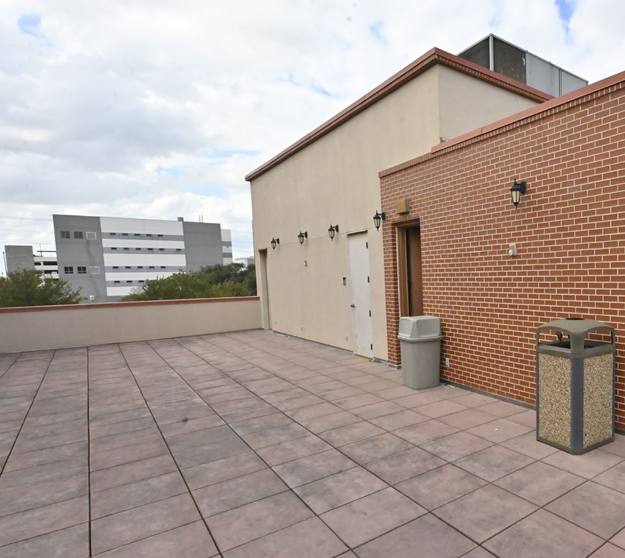
- • Wraparound deck on 2nd and 3rd floors
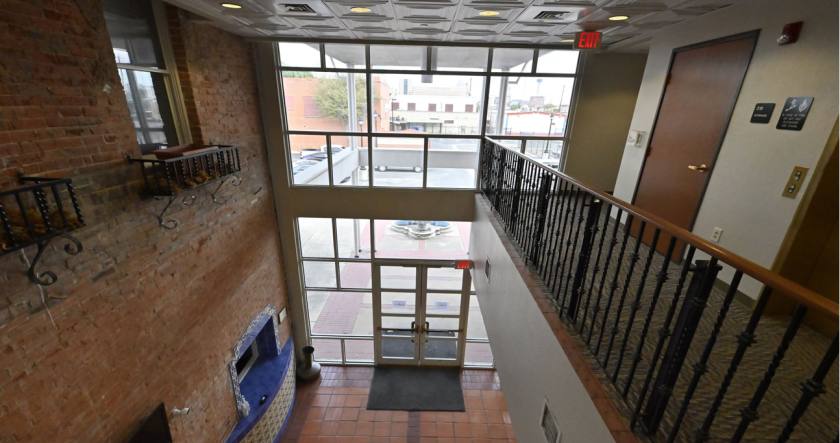
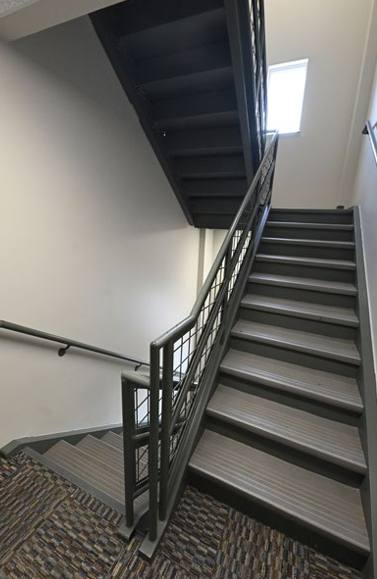
Additional Photos

Listing Agents

Michael Morse
O: 210-524-4000
M: 210-524-1312
mmorse@reocsanantonio.com
O: 210-524-4000
M: 210-524-1312
mmorse@reocsanantonio.com
While we strive to provide the most accurate information, all listing information, and demographic data, is provided by third-parties. As such, MyEListing will not be responsible for the accuracy of the information. It is strongly recommended that you verify all information with the listing agent, and any relevant agencies, prior to making any decisions.